备注
Go to the end 下载完整的示例代码。或者通过浏览器中的MysterLite或Binder运行此示例
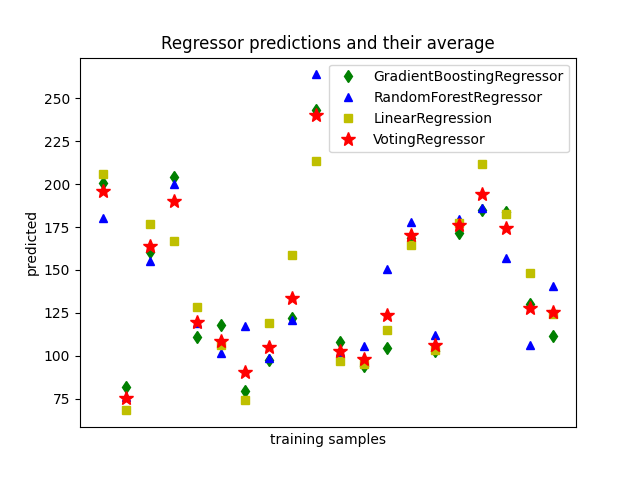
绘制个人和投票回归预测图#
投票回归量是一个整体元估计器,它适合多个基本回归量,每个基本回归量都在整个数据集中。然后它对各个预测进行平均以形成最终预测。我们将使用三个不同的回归量来预测数据: GradientBoostingRegressor , RandomForestRegressor ,而且 LinearRegression ).那么上述3个回归子将用于 VotingRegressor .
最后,我们将绘制所有模型做出的预测以进行比较。
我们将使用糖尿病数据集,该数据集由从糖尿病患者队列中收集的10个特征组成。该目标是基线后一年疾病进展的定量测量。
# Authors: The scikit-learn developers
# SPDX-License-Identifier: BSD-3-Clause

import matplotlib.pyplot as plt

from sklearn.datasets import load_diabetes
from sklearn.ensemble import (
    GradientBoostingRegressor,
    RandomForestRegressor,
    VotingRegressor,
)
from sklearn.linear_model import LinearRegression
训练分类器#
首先,我们将加载糖尿病数据集并启动梯度增强回归器、随机森林回归器和线性回归。接下来,我们将使用3个回归量来构建投票回归量:
X, y = load_diabetes(return_X_y=True)

# Train classifiers
reg1 = GradientBoostingRegressor(random_state=1)
reg2 = RandomForestRegressor(random_state=1)
reg3 = LinearRegression()

reg1.fit(X, y)
reg2.fit(X, y)
reg3.fit(X, y)

ereg = VotingRegressor([("gb", reg1), ("rf", reg2), ("lr", reg3)])
ereg.fit(X, y)
做出预测#
现在,我们将使用每个回归变量来进行20个第一预测。
xt = X[:20]

pred1 = reg1.predict(xt)
pred2 = reg2.predict(xt)
pred3 = reg3.predict(xt)
pred4 = ereg.predict(xt)
绘制结果#
最后,我们将可视化20个预测。红星显示了由 VotingRegressor .
plt.figure()
plt.plot(pred1, "gd", label="GradientBoostingRegressor")
plt.plot(pred2, "b^", label="RandomForestRegressor")
plt.plot(pred3, "ys", label="LinearRegression")
plt.plot(pred4, "r*", ms=10, label="VotingRegressor")

plt.tick_params(axis="x", which="both", bottom=False, top=False, labelbottom=False)
plt.ylabel("predicted")
plt.xlabel("training samples")
plt.legend(loc="best")
plt.title("Regressor predictions and their average")

plt.show()
Total running time of the script: (0分0.788秒)
相关实例
Gallery generated by Sphinx-Gallery <https://sphinx-gallery.github.io> _