备注
Go to the end 下载完整的示例代码。或者通过浏览器中的MysterLite或Binder运行此示例
用排列测试分类分数的重要性#
本示例说明使用 permutation_test_score 使用排列评估交叉验证分数的重要性。
# Authors: The scikit-learn developers
# SPDX-License-Identifier: BSD-3-Clause
数据集#
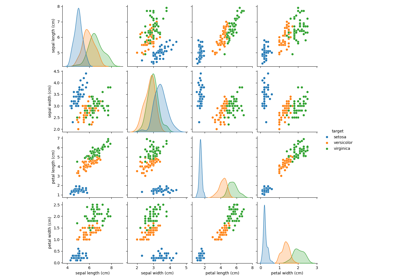
我们将使用 虹膜植物数据集 ,其中包括对3个虹膜物种的测量结果。我们的模型将使用测量结果来预测虹膜物种。
from sklearn.datasets import load_iris

iris = load_iris()
X = iris.data
y = iris.target
为了进行比较,我们还生成一些随机特征数据(即,20个特征),与虹膜数据集中的类别标签不相关。
import numpy as np

n_uncorrelated_features = 20
rng = np.random.RandomState(seed=0)
# Use same number of samples as in iris and 20 features
X_rand = rng.normal(size=(X.shape[0], n_uncorrelated_features))
排列测试分数#
接下来,我们计算 permutation_test_score 对于这两者,原始的虹膜数据集(特征和标签之间存在很强的关系)和随机生成的具有虹膜标签的特征(预计特征和标签之间没有依赖性)。公司现采用国际 SVC 分类器和 准确度分数 在每一轮评估模型。
permutation_test_score 通过在数据集的1000个不同排列上计算分类器的准确度来生成空分布,其中特征保持相同,但标签经历不同的随机排列。这是零假设的分布,说明特征和标签之间没有依赖关系。然后,经验p值被计算为排列的比例,对于该比例,由在排列上训练的模型获得的分数大于或等于使用原始数据获得的分数。
from sklearn.model_selection import StratifiedKFold, permutation_test_score
from sklearn.svm import SVC

clf = SVC(kernel="linear", random_state=7)
cv = StratifiedKFold(n_splits=2, shuffle=True, random_state=0)

score_iris, perm_scores_iris, pvalue_iris = permutation_test_score(
    clf, X, y, scoring="accuracy", cv=cv, n_permutations=1000
)

score_rand, perm_scores_rand, pvalue_rand = permutation_test_score(
    clf, X_rand, y, scoring="accuracy", cv=cv, n_permutations=1000
)
原始数据#
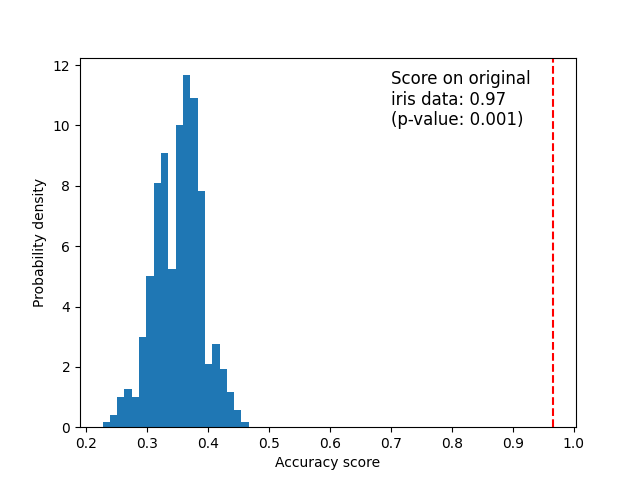
下面我们绘制了排列分数(零分布)的图表。红线表示分类器对原始数据获得的分数(没有排列标签)。该分数比使用排列数据获得的分数好得多,因此p值非常低。这表明仅凭偶然获得这个好分数的可能性很低。它提供了证据,证明虹膜数据集包含特征和标签之间的真正依赖性,并且分类器能够利用这一点来获得良好的结果。低p值可能导致我们拒绝零假设。
import matplotlib.pyplot as plt

fig, ax = plt.subplots()

ax.hist(perm_scores_iris, bins=20, density=True)
ax.axvline(score_iris, ls="--", color="r")
score_label = (
    f"Score on original\niris data: {score_iris:.2f}\n(p-value: {pvalue_iris:.3f})"
)
ax.text(0.7, 10, score_label, fontsize=12)
ax.set_xlabel("Accuracy score")
_ = ax.set_ylabel("Probability density")
随机数据#
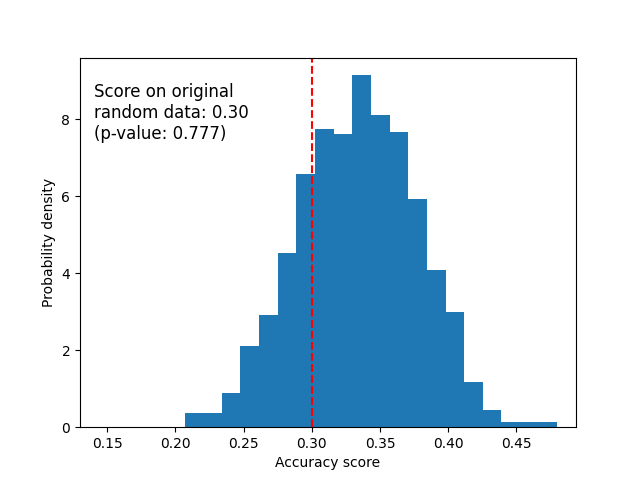
下面我们绘制了随机数据的零分布。排列分数与使用原始虹膜数据集获得的分数相似,因为排列总是破坏存在的任何特征标签依赖性。不过,在这种情况下,随机数据获得的分数非常差。这导致p值很大,证实随机数据中不存在特征标签依赖性。
fig, ax = plt.subplots()

ax.hist(perm_scores_rand, bins=20, density=True)
ax.set_xlim(0.13)
ax.axvline(score_rand, ls="--", color="r")
score_label = (
    f"Score on original\nrandom data: {score_rand:.2f}\n(p-value: {pvalue_rand:.3f})"
)
ax.text(0.14, 7.5, score_label, fontsize=12)
ax.set_xlabel("Accuracy score")
ax.set_ylabel("Probability density")
plt.show()
获得高p值的另一个可能原因是分类器无法使用数据中的结构。在这种情况下,p值将仅对于能够利用存在的依赖性的分类器是低的。在我们上面的例子中,数据是随机的,所有分类器都将具有高p值,因为数据中不存在结构。我们可能会也可能不会拒绝零假设,这取决于p值是否也在更合适的估计量上很高。
最后,请注意,即使数据中只有弱结构,此测试也会产生较低的p值 [1].
引用
Total running time of the script: (0分10.389秒)
相关实例
Gallery generated by Sphinx-Gallery <https://sphinx-gallery.github.io> _