备注
Go to the end 下载完整的示例代码。或者通过浏览器中的MysterLite或Binder运行此示例
K-Means和MiniBatchKMeans集群算法的比较#
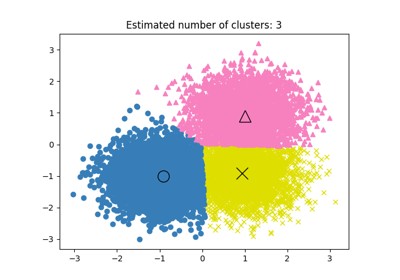
我们想比较MiniBatchKMeans和KMeans的性能:MiniBatchKMeans更快,但结果略有不同(请参见 小批量K均值 ).
我们将首先使用KMeans,然后使用MiniBatchKMeans对一组数据进行聚集,并绘制结果。我们还将绘制两种算法之间标签不同的点。
# Authors: The scikit-learn developers
# SPDX-License-Identifier: BSD-3-Clause
生成数据#
我们首先生成要集群的数据团块。
import numpy as np

from sklearn.datasets import make_blobs

np.random.seed(0)

batch_size = 45
centers = [[1, 1], [-1, -1], [1, -1]]
n_clusters = len(centers)
X, labels_true = make_blobs(n_samples=3000, centers=centers, cluster_std=0.7)
使用KMeans计算集群#
import time

from sklearn.cluster import KMeans

k_means = KMeans(init="k-means++", n_clusters=3, n_init=10)
t0 = time.time()
k_means.fit(X)
t_batch = time.time() - t0
使用MiniBatchKMeans计算集群#
from sklearn.cluster import MiniBatchKMeans

mbk = MiniBatchKMeans(
    init="k-means++",
    n_clusters=3,
    batch_size=batch_size,
    n_init=10,
    max_no_improvement=10,
    verbose=0,
)
t0 = time.time()
mbk.fit(X)
t_mini_batch = time.time() - t0
建立集群之间的平等#
We want to have the same color for the same cluster from both the MiniBatchKMeans and the KMeans algorithm. Let's pair the cluster centers per closest one.
from sklearn.metrics.pairwise import pairwise_distances_argmin

k_means_cluster_centers = k_means.cluster_centers_
order = pairwise_distances_argmin(k_means.cluster_centers_, mbk.cluster_centers_)
mbk_means_cluster_centers = mbk.cluster_centers_[order]

k_means_labels = pairwise_distances_argmin(X, k_means_cluster_centers)
mbk_means_labels = pairwise_distances_argmin(X, mbk_means_cluster_centers)
绘制结果#
import matplotlib.pyplot as plt

fig = plt.figure(figsize=(8, 3))
fig.subplots_adjust(left=0.02, right=0.98, bottom=0.05, top=0.9)
colors = ["#4EACC5", "#FF9C34", "#4E9A06"]

# KMeans
ax = fig.add_subplot(1, 3, 1)
for k, col in zip(range(n_clusters), colors):
    my_members = k_means_labels == k
    cluster_center = k_means_cluster_centers[k]
    ax.plot(X[my_members, 0], X[my_members, 1], "w", markerfacecolor=col, marker=".")
    ax.plot(
        cluster_center[0],
        cluster_center[1],
        "o",
        markerfacecolor=col,
        markeredgecolor="k",
        markersize=6,
    )
ax.set_title("KMeans")
ax.set_xticks(())
ax.set_yticks(())
plt.text(-3.5, 1.8, "train time: %.2fs\ninertia: %f" % (t_batch, k_means.inertia_))

# MiniBatchKMeans
ax = fig.add_subplot(1, 3, 2)
for k, col in zip(range(n_clusters), colors):
    my_members = mbk_means_labels == k
    cluster_center = mbk_means_cluster_centers[k]
    ax.plot(X[my_members, 0], X[my_members, 1], "w", markerfacecolor=col, marker=".")
    ax.plot(
        cluster_center[0],
        cluster_center[1],
        "o",
        markerfacecolor=col,
        markeredgecolor="k",
        markersize=6,
    )
ax.set_title("MiniBatchKMeans")
ax.set_xticks(())
ax.set_yticks(())
plt.text(-3.5, 1.8, "train time: %.2fs\ninertia: %f" % (t_mini_batch, mbk.inertia_))

# Initialize the different array to all False
different = mbk_means_labels == 4
ax = fig.add_subplot(1, 3, 3)

for k in range(n_clusters):
    different += (k_means_labels == k) != (mbk_means_labels == k)

identical = np.logical_not(different)
ax.plot(X[identical, 0], X[identical, 1], "w", markerfacecolor="#bbbbbb", marker=".")
ax.plot(X[different, 0], X[different, 1], "w", markerfacecolor="m", marker=".")
ax.set_title("Difference")
ax.set_xticks(())
ax.set_yticks(())

plt.show()

Total running time of the script: (0分0.134秒)
相关实例
Gallery generated by Sphinx-Gallery <https://sphinx-gallery.github.io> _