备注
Go to the end 下载完整的示例代码。或者通过浏览器中的MysterLite或Binder运行此示例
嵌套与非嵌套交叉验证#
此示例比较了虹膜数据集分类器上的非嵌套和嵌套交叉验证策略。嵌套交叉验证(CV)通常用于训练其中超参数也需要优化的模型。嵌套CV估计基础模型及其(超)参数搜索的概括误差。选择最大化非嵌套CV的参数会使模型与数据集产生偏差,从而产生过于乐观的分数。
无嵌套CV的模型选择使用相同的数据来调整模型参数和评估模型性能。因此,信息可能会“泄漏”到模型中并过拟合数据。这种影响的大小主要取决于数据集的大小和模型的稳定性。参见Cawley和Talbot [1] 以分析这些问题。
为了避免这个问题,嵌套CV有效地使用了一系列的训练/验证/测试集分割。在内部循环中(这里由 GridSearchCV ),通过将模型匹配到每个训练集来使分数大致最大化,然后在选择验证集中的(超)参数时直接最大化。在外循环中(在这里 cross_val_score ),通过对几个数据集分割的测试集得分求平均来估计概括误差。
下面的示例使用具有非线性内核的支持向量分类器通过网格搜索构建具有优化超参数的模型。我们比较了非嵌套和嵌套的CV策略的性能,采取他们的分数之间的差异。
引用
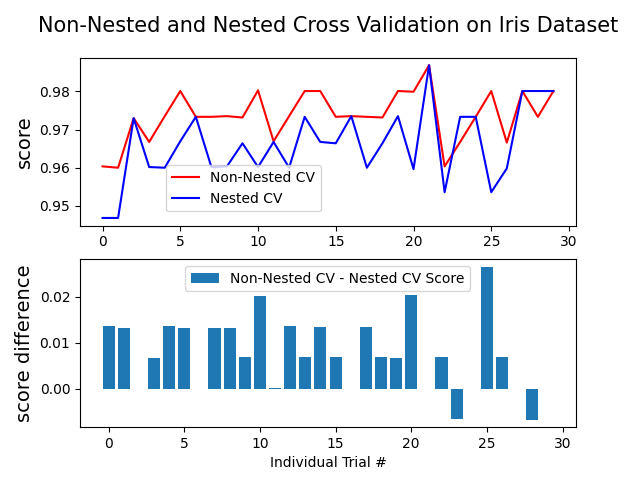
Average difference of 0.007581 with std. dev. of 0.007833.
# Authors: The scikit-learn developers
# SPDX-License-Identifier: BSD-3-Clause

import numpy as np
from matplotlib import pyplot as plt

from sklearn.datasets import load_iris
from sklearn.model_selection import GridSearchCV, KFold, cross_val_score
from sklearn.svm import SVC

# Number of random trials
NUM_TRIALS = 30

# Load the dataset
iris = load_iris()
X_iris = iris.data
y_iris = iris.target

# Set up possible values of parameters to optimize over
p_grid = {"C": [1, 10, 100], "gamma": [0.01, 0.1]}

# We will use a Support Vector Classifier with "rbf" kernel
svm = SVC(kernel="rbf")

# Arrays to store scores
non_nested_scores = np.zeros(NUM_TRIALS)
nested_scores = np.zeros(NUM_TRIALS)

# Loop for each trial
for i in range(NUM_TRIALS):
    # Choose cross-validation techniques for the inner and outer loops,
    # independently of the dataset.
    # E.g "GroupKFold", "LeaveOneOut", "LeaveOneGroupOut", etc.
    inner_cv = KFold(n_splits=4, shuffle=True, random_state=i)
    outer_cv = KFold(n_splits=4, shuffle=True, random_state=i)

    # Non_nested parameter search and scoring
    clf = GridSearchCV(estimator=svm, param_grid=p_grid, cv=outer_cv)
    clf.fit(X_iris, y_iris)
    non_nested_scores[i] = clf.best_score_

    # Nested CV with parameter optimization
    clf = GridSearchCV(estimator=svm, param_grid=p_grid, cv=inner_cv)
    nested_score = cross_val_score(clf, X=X_iris, y=y_iris, cv=outer_cv)
    nested_scores[i] = nested_score.mean()

score_difference = non_nested_scores - nested_scores

print(
    "Average difference of {:6f} with std. dev. of {:6f}.".format(
        score_difference.mean(), score_difference.std()
    )
)

# Plot scores on each trial for nested and non-nested CV
plt.figure()
plt.subplot(211)
(non_nested_scores_line,) = plt.plot(non_nested_scores, color="r")
(nested_line,) = plt.plot(nested_scores, color="b")
plt.ylabel("score", fontsize="14")
plt.legend(
    [non_nested_scores_line, nested_line],
    ["Non-Nested CV", "Nested CV"],
    bbox_to_anchor=(0, 0.4, 0.5, 0),
)
plt.title(
    "Non-Nested and Nested Cross Validation on Iris Dataset",
    x=0.5,
    y=1.1,
    fontsize="15",
)

# Plot bar chart of the difference.
plt.subplot(212)
difference_plot = plt.bar(range(NUM_TRIALS), score_difference)
plt.xlabel("Individual Trial #")
plt.legend(
    [difference_plot],
    ["Non-Nested CV - Nested CV Score"],
    bbox_to_anchor=(0, 1, 0.8, 0),
)
plt.ylabel("score difference", fontsize="14")

plt.show()
Total running time of the script: (0分5.101秒)
相关实例

Gallery generated by Sphinx-Gallery <https://sphinx-gallery.github.io> _