备注
Go to the end 下载完整的示例代码。或者通过浏览器中的MysterLite或Binder运行此示例
数字分类的受限制Boltzmann Machine功能#
对于像素值可以解释为白色背景上的黑度的灰度图像数据,例如手写数字识别,伯努里限制Boltzmann机模型 (BernoulliRBM )可以执行有效的非线性特征提取。
# Authors: The scikit-learn developers
# SPDX-License-Identifier: BSD-3-Clause
生成数据#
为了从小数据集中学习良好的潜在表示,我们通过在每个方向上以1个像素的线性位移扰动训练数据来人为生成更多标记的数据。
import numpy as np
from scipy.ndimage import convolve

from sklearn import datasets
from sklearn.model_selection import train_test_split
from sklearn.preprocessing import minmax_scale


def nudge_dataset(X, Y):
    """
    This produces a dataset 5 times bigger than the original one,
    by moving the 8x8 images in X around by 1px to left, right, down, up
    """
    direction_vectors = [
        [[0, 1, 0], [0, 0, 0], [0, 0, 0]],
        [[0, 0, 0], [1, 0, 0], [0, 0, 0]],
        [[0, 0, 0], [0, 0, 1], [0, 0, 0]],
        [[0, 0, 0], [0, 0, 0], [0, 1, 0]],
    ]

    def shift(x, w):
        return convolve(x.reshape((8, 8)), mode="constant", weights=w).ravel()

    X = np.concatenate(
        [X] + [np.apply_along_axis(shift, 1, X, vector) for vector in direction_vectors]
    )
    Y = np.concatenate([Y for _ in range(5)], axis=0)
    return X, Y


X, y = datasets.load_digits(return_X_y=True)
X = np.asarray(X, "float32")
X, Y = nudge_dataset(X, y)
X = minmax_scale(X, feature_range=(0, 1))  # 0-1 scaling

X_train, X_test, Y_train, Y_test = train_test_split(X, Y, test_size=0.2, random_state=0)
模型定义#
我们构建了一个具有BernoulliRBM特征提取器和 LogisticRegression 分类器
from sklearn import linear_model
from sklearn.neural_network import BernoulliRBM
from sklearn.pipeline import Pipeline

logistic = linear_model.LogisticRegression(solver="newton-cg", tol=1)
rbm = BernoulliRBM(random_state=0, verbose=True)

rbm_features_classifier = Pipeline(steps=[("rbm", rbm), ("logistic", logistic)])
培训#
整个模型的超参数(学习率、隐藏层大小、正规化)通过网格搜索进行了优化,但由于运行时限制,搜索不会在这里重现。
from sklearn.base import clone

# Hyper-parameters. These were set by cross-validation,
# using a GridSearchCV. Here we are not performing cross-validation to
# save time.
rbm.learning_rate = 0.06
rbm.n_iter = 10

# More components tend to give better prediction performance, but larger
# fitting time
rbm.n_components = 100
logistic.C = 6000

# Training RBM-Logistic Pipeline
rbm_features_classifier.fit(X_train, Y_train)

# Training the Logistic regression classifier directly on the pixel
raw_pixel_classifier = clone(logistic)
raw_pixel_classifier.C = 100.0
raw_pixel_classifier.fit(X_train, Y_train)
[BernoulliRBM] Iteration 1, pseudo-likelihood = -25.57, time = 0.08s
[BernoulliRBM] Iteration 2, pseudo-likelihood = -23.68, time = 0.16s
[BernoulliRBM] Iteration 3, pseudo-likelihood = -22.88, time = 0.16s
[BernoulliRBM] Iteration 4, pseudo-likelihood = -21.91, time = 0.19s
[BernoulliRBM] Iteration 5, pseudo-likelihood = -21.79, time = 0.16s
[BernoulliRBM] Iteration 6, pseudo-likelihood = -20.96, time = 0.15s
[BernoulliRBM] Iteration 7, pseudo-likelihood = -20.88, time = 0.17s
[BernoulliRBM] Iteration 8, pseudo-likelihood = -20.50, time = 0.15s
[BernoulliRBM] Iteration 9, pseudo-likelihood = -20.34, time = 0.16s
[BernoulliRBM] Iteration 10, pseudo-likelihood = -20.21, time = 0.16s
评价#
from sklearn import metrics

Y_pred = rbm_features_classifier.predict(X_test)
print(
    "Logistic regression using RBM features:\n%s\n"
    % (metrics.classification_report(Y_test, Y_pred))
)
/xpy/lib/python3.11/site-packages/sklearn/metrics/_classification.py:1565: UndefinedMetricWarning:

Precision is ill-defined and being set to 0.0 in labels with no predicted samples. Use `zero_division` parameter to control this behavior.

/xpy/lib/python3.11/site-packages/sklearn/metrics/_classification.py:1565: UndefinedMetricWarning:

Precision is ill-defined and being set to 0.0 in labels with no predicted samples. Use `zero_division` parameter to control this behavior.

/xpy/lib/python3.11/site-packages/sklearn/metrics/_classification.py:1565: UndefinedMetricWarning:

Precision is ill-defined and being set to 0.0 in labels with no predicted samples. Use `zero_division` parameter to control this behavior.

Logistic regression using RBM features:
              precision    recall  f1-score   support

           0       0.10      1.00      0.18       174
           1       0.00      0.00      0.00       184
           2       0.00      0.00      0.00       166
           3       0.00      0.00      0.00       194
           4       0.00      0.00      0.00       186
           5       0.00      0.00      0.00       181
           6       0.00      0.00      0.00       207
           7       0.00      0.00      0.00       154
           8       0.00      0.00      0.00       182
           9       0.00      0.00      0.00       169

    accuracy                           0.10      1797
   macro avg       0.01      0.10      0.02      1797
weighted avg       0.01      0.10      0.02      1797
Y_pred = raw_pixel_classifier.predict(X_test)
print(
    "Logistic regression using raw pixel features:\n%s\n"
    % (metrics.classification_report(Y_test, Y_pred))
)
/xpy/lib/python3.11/site-packages/sklearn/metrics/_classification.py:1565: UndefinedMetricWarning:

Precision is ill-defined and being set to 0.0 in labels with no predicted samples. Use `zero_division` parameter to control this behavior.

/xpy/lib/python3.11/site-packages/sklearn/metrics/_classification.py:1565: UndefinedMetricWarning:

Precision is ill-defined and being set to 0.0 in labels with no predicted samples. Use `zero_division` parameter to control this behavior.

/xpy/lib/python3.11/site-packages/sklearn/metrics/_classification.py:1565: UndefinedMetricWarning:

Precision is ill-defined and being set to 0.0 in labels with no predicted samples. Use `zero_division` parameter to control this behavior.

Logistic regression using raw pixel features:
              precision    recall  f1-score   support

           0       0.10      1.00      0.18       174
           1       0.00      0.00      0.00       184
           2       0.00      0.00      0.00       166
           3       0.00      0.00      0.00       194
           4       0.00      0.00      0.00       186
           5       0.00      0.00      0.00       181
           6       0.00      0.00      0.00       207
           7       0.00      0.00      0.00       154
           8       0.00      0.00      0.00       182
           9       0.00      0.00      0.00       169

    accuracy                           0.10      1797
   macro avg       0.01      0.10      0.02      1797
weighted avg       0.01      0.10      0.02      1797
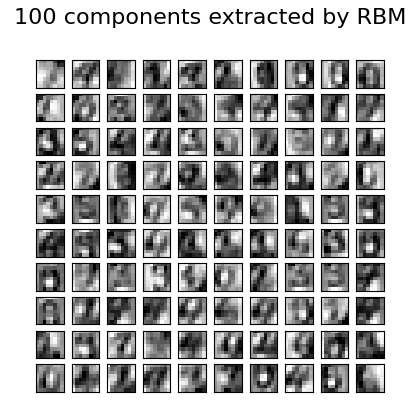
BernoulliRBM提取的特征有助于提高原始像素上逻辑回归的分类精度。
密谋#
import matplotlib.pyplot as plt

plt.figure(figsize=(4.2, 4))
for i, comp in enumerate(rbm.components_):
    plt.subplot(10, 10, i + 1)
    plt.imshow(comp.reshape((8, 8)), cmap=plt.cm.gray_r, interpolation="nearest")
    plt.xticks(())
    plt.yticks(())
plt.suptitle("100 components extracted by RBM", fontsize=16)
plt.subplots_adjust(0.08, 0.02, 0.92, 0.85, 0.08, 0.23)

plt.show()
Total running time of the script: (0分2.612秒)
相关实例
Gallery generated by Sphinx-Gallery <https://sphinx-gallery.github.io> _