备注
Go to the end 下载完整的示例代码。或者通过浏览器中的MysterLite或Binder运行此示例
部分相关的高级绘图#
的 PartialDependenceDisplay 对象可以用于绘图,而无需重新计算部分依赖关系。在本示例中,我们展示了如何绘制部分依赖图以及如何使用可视化API快速自定义图。
备注
另见 sphx_glr_auto_examples_miscellaneous_plot_roc_curve_visualization_api.py
# Authors: The scikit-learn developers
# SPDX-License-Identifier: BSD-3-Clause

import matplotlib.pyplot as plt
import pandas as pd

from sklearn.datasets import load_diabetes
from sklearn.inspection import PartialDependenceDisplay
from sklearn.neural_network import MLPRegressor
from sklearn.pipeline import make_pipeline
from sklearn.preprocessing import StandardScaler
from sklearn.tree import DecisionTreeRegressor
在糖尿病数据集上训练模型#
首先,我们在糖尿病数据集上训练决策树和多层感知器。
diabetes = load_diabetes()
X = pd.DataFrame(diabetes.data, columns=diabetes.feature_names)
y = diabetes.target

tree = DecisionTreeRegressor()
mlp = make_pipeline(
    StandardScaler(),
    MLPRegressor(hidden_layer_sizes=(100, 100), tol=1e-2, max_iter=500, random_state=0),
)
tree.fit(X, y)
mlp.fit(X, y)
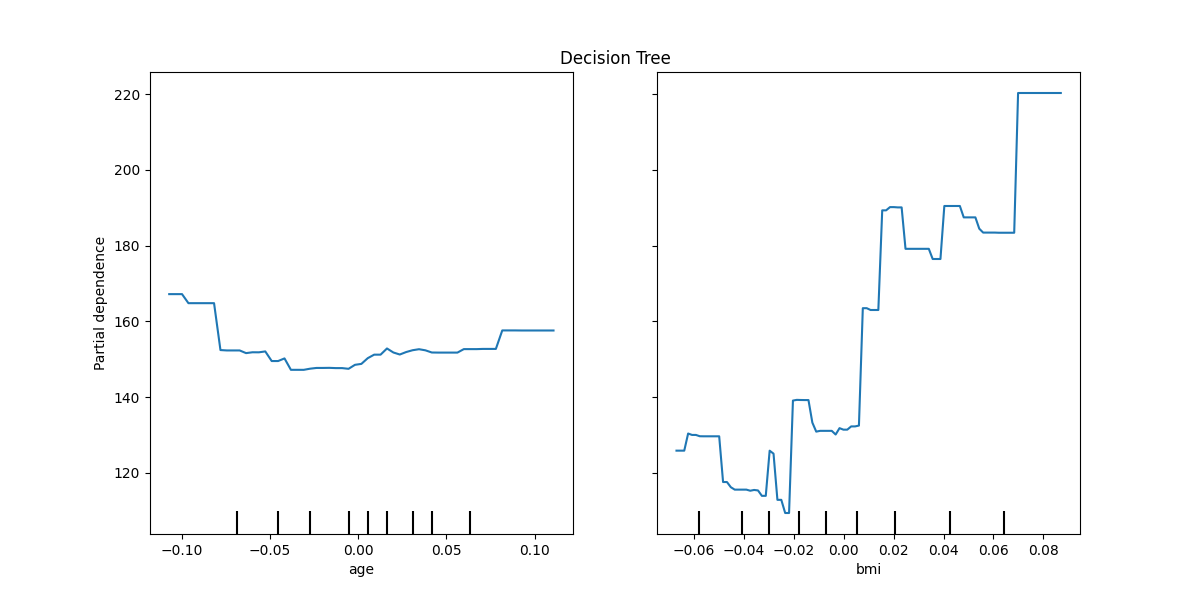
绘制两个要素的部分依赖性#
我们为决策树绘制了特征“年龄”和“bmi”(体重指数)的部分依赖曲线。有两个特点, from_estimator 预计绘制两条曲线。此处,plot功能使用以下定义的空间放置两个plot的网格 ax .
fig, ax = plt.subplots(figsize=(12, 6))
ax.set_title("Decision Tree")
tree_disp = PartialDependenceDisplay.from_estimator(tree, X, ["age", "bmi"], ax=ax)
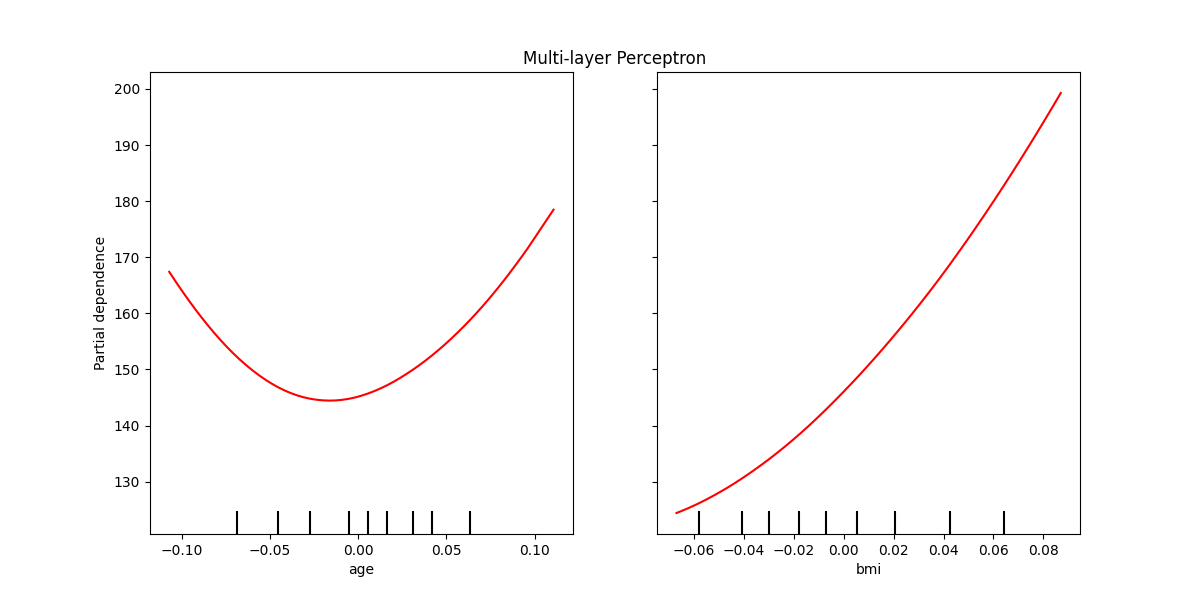
可以为多层感知器绘制部分依赖曲线。在这种情况下, line_kw 被传递到 from_estimator 以更改曲线的颜色。
fig, ax = plt.subplots(figsize=(12, 6))
ax.set_title("Multi-layer Perceptron")
mlp_disp = PartialDependenceDisplay.from_estimator(
    mlp, X, ["age", "bmi"], ax=ax, line_kw={"color": "red"}
)
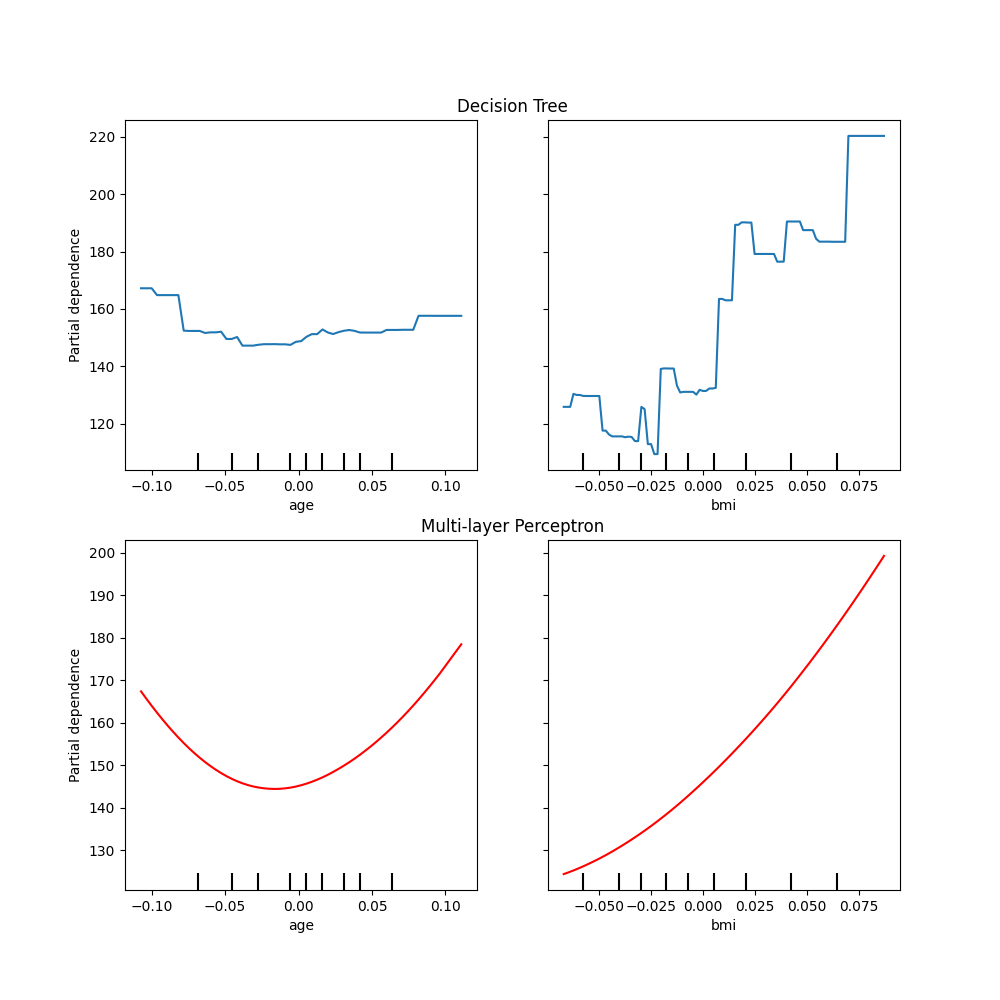
绘制两个模型的部分依赖性#
的 tree_disp 和 mlp_disp PartialDependenceDisplay 对象包含重建部分依赖曲线所需的所有计算信息。这意味着我们可以轻松创建额外的图,而无需重新计算曲线。
绘制曲线的一种方法是将它们放置在同一个图形中,每个模型的曲线位于每一行上。首先,我们创建一个具有两个轴、两行一列的图形。两个轴传递给 plot 功能 tree_disp 和 mlp_disp .绘制函数将使用给定的轴来绘制部分依赖关系。生成的图将决策树部分依赖曲线放置在第二行的多层感知器的第一行中。
fig, (ax1, ax2) = plt.subplots(2, 1, figsize=(10, 10))
tree_disp.plot(ax=ax1)
ax1.set_title("Decision Tree")
mlp_disp.plot(ax=ax2, line_kw={"color": "red"})
ax2.set_title("Multi-layer Perceptron")
Text(0.5, 1.0, 'Multi-layer Perceptron')
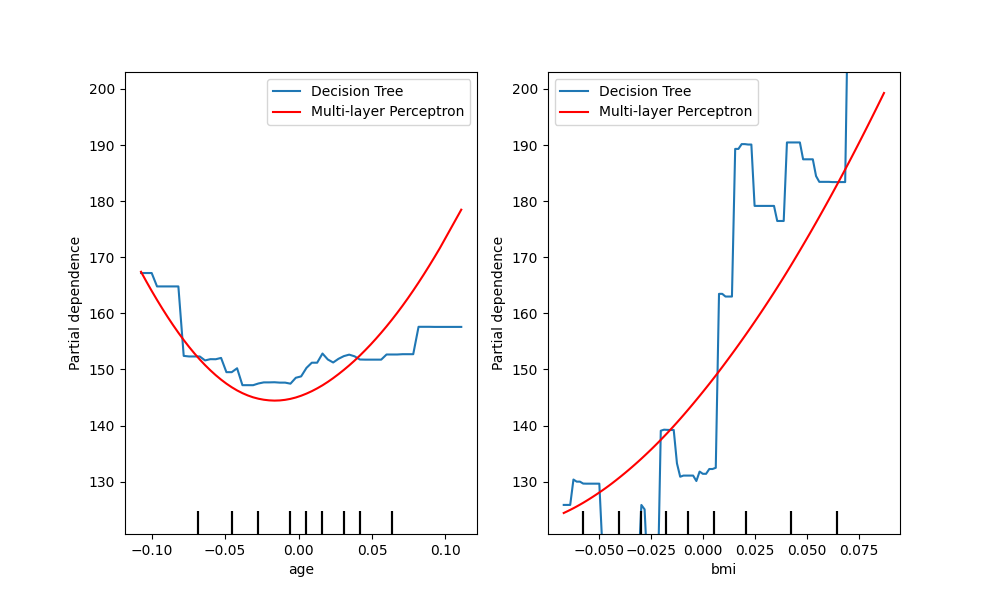
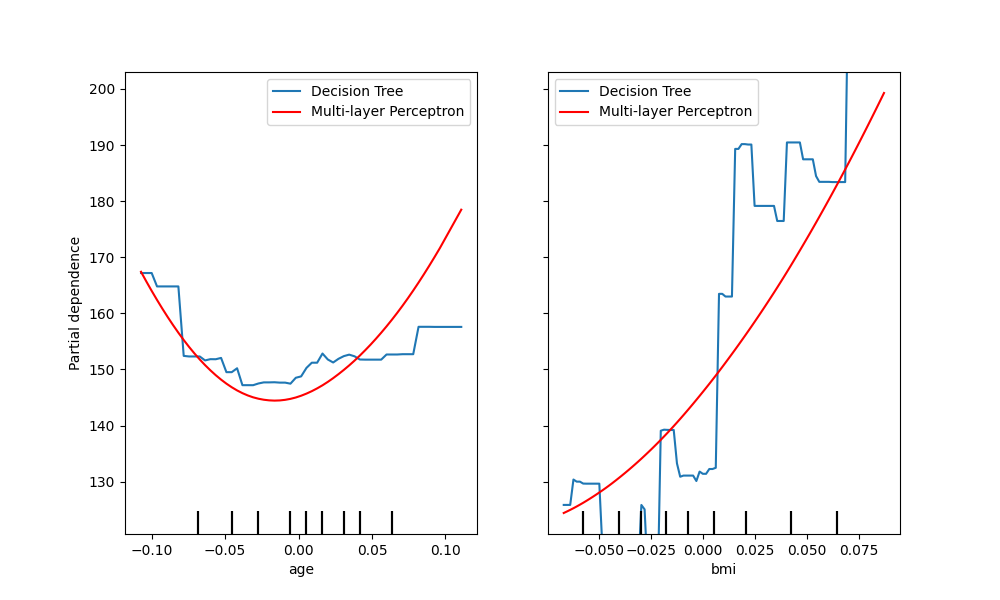
比较曲线的另一种方法是将它们彼此叠加绘制。在这里,我们创建一个具有一行两列的图形。斧头被传递到 plot 功能为列表,将在同一轴上绘制每个模型的部分依赖曲线。轴列表的长度必须等于绘制的地块数量。
fig, (ax1, ax2) = plt.subplots(1, 2, figsize=(10, 6))
tree_disp.plot(ax=[ax1, ax2], line_kw={"label": "Decision Tree"})
mlp_disp.plot(
    ax=[ax1, ax2], line_kw={"label": "Multi-layer Perceptron", "color": "red"}
)
ax1.legend()
ax2.legend()
<matplotlib.legend.Legend object at 0x7fa26ee17590>
tree_disp.axes_ 是一个numpy数组容器,用于绘制部分依赖图的轴。这可以传递给 mlp_disp 来达到同样的效果,把图一个一个地画出来。而且 mlp_disp.figure_ 存储数字,允许在调用后重新加载数字 plot .在这种情况下 tree_disp.axes_ 具有两个维度,因此 plot 将仅在最左侧的图中显示y标签和y勾号。
tree_disp.plot(line_kw={"label": "Decision Tree"})
mlp_disp.plot(
    line_kw={"label": "Multi-layer Perceptron", "color": "red"}, ax=tree_disp.axes_
)
tree_disp.figure_.set_size_inches(10, 6)
tree_disp.axes_[0, 0].legend()
tree_disp.axes_[0, 1].legend()
plt.show()
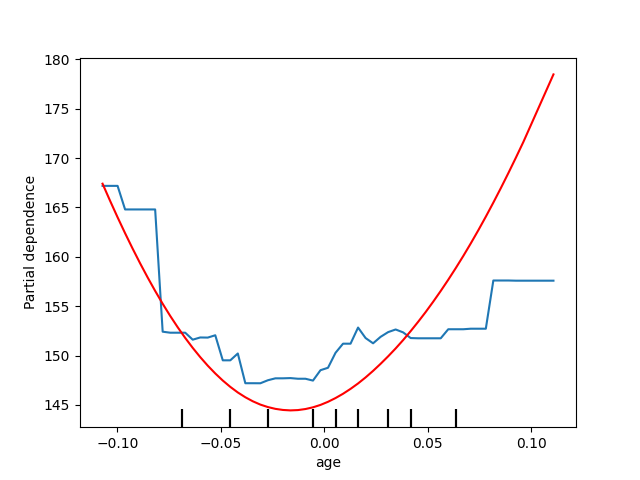
绘制一个要素的部分依赖性#
在这里,我们在同一轴上绘制了单个特征“年龄”的部分依赖曲线。在这种情况下, tree_disp.axes_ 被传递到第二个情节函数中。
tree_disp = PartialDependenceDisplay.from_estimator(tree, X, ["age"])
mlp_disp = PartialDependenceDisplay.from_estimator(
    mlp, X, ["age"], ax=tree_disp.axes_, line_kw={"color": "red"}
)
Total running time of the script: (0分2.987秒)
相关实例
Gallery generated by Sphinx-Gallery <https://sphinx-gallery.github.io> _