备注
Go to the end 下载完整的示例代码。或者通过浏览器中的MysterLite或Binder运行此示例
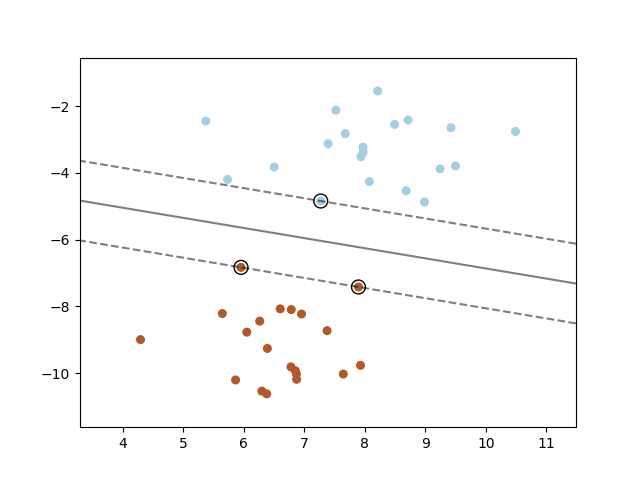
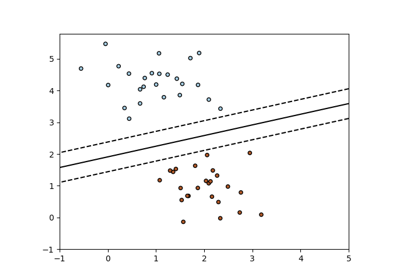
SV:最大裕度分离超平面#
使用具有线性核的支持向量机分类器在两类可分离数据集中绘制最大裕度分离超平面。
# Authors: The scikit-learn developers
# SPDX-License-Identifier: BSD-3-Clause

import matplotlib.pyplot as plt

from sklearn import svm
from sklearn.datasets import make_blobs
from sklearn.inspection import DecisionBoundaryDisplay

# we create 40 separable points
X, y = make_blobs(n_samples=40, centers=2, random_state=6)

# fit the model, don't regularize for illustration purposes
clf = svm.SVC(kernel="linear", C=1000)
clf.fit(X, y)

plt.scatter(X[:, 0], X[:, 1], c=y, s=30, cmap=plt.cm.Paired)

# plot the decision function
ax = plt.gca()
DecisionBoundaryDisplay.from_estimator(
    clf,
    X,
    plot_method="contour",
    colors="k",
    levels=[-1, 0, 1],
    alpha=0.5,
    linestyles=["--", "-", "--"],
    ax=ax,
)
# plot support vectors
ax.scatter(
    clf.support_vectors_[:, 0],
    clf.support_vectors_[:, 1],
    s=100,
    linewidth=1,
    facecolors="none",
    edgecolors="k",
)
plt.show()
Total running time of the script: (0分0.051秒)
相关实例
Gallery generated by Sphinx-Gallery <https://sphinx-gallery.github.io> _