备注
Go to the end 下载完整的示例代码。或者通过浏览器中的MysterLite或Binder运行此示例
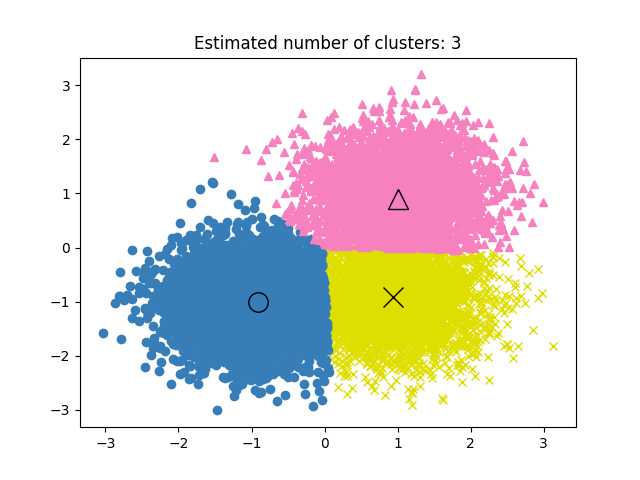
均值漂移集群算法的演示#
参考:
Dorin Comaniciu和Peter Meer,“Mean Shift:一种面向特征空间分析的鲁棒方法”。IEEE模式分析和机器智能汇刊。2002. pp. 603-619.
# Authors: The scikit-learn developers
# SPDX-License-Identifier: BSD-3-Clause

import numpy as np

from sklearn.cluster import MeanShift, estimate_bandwidth
from sklearn.datasets import make_blobs
生成示例数据#
centers = [[1, 1], [-1, -1], [1, -1]]
X, _ = make_blobs(n_samples=10000, centers=centers, cluster_std=0.6)
使用MeanChange计算集群#
# The following bandwidth can be automatically detected using
bandwidth = estimate_bandwidth(X, quantile=0.2, n_samples=500)

ms = MeanShift(bandwidth=bandwidth, bin_seeding=True)
ms.fit(X)
labels = ms.labels_
cluster_centers = ms.cluster_centers_

labels_unique = np.unique(labels)
n_clusters_ = len(labels_unique)

print("number of estimated clusters : %d" % n_clusters_)
number of estimated clusters : 3
情节结果#
import matplotlib.pyplot as plt

plt.figure(1)
plt.clf()

colors = ["#dede00", "#377eb8", "#f781bf"]
markers = ["x", "o", "^"]

for k, col in zip(range(n_clusters_), colors):
    my_members = labels == k
    cluster_center = cluster_centers[k]
    plt.plot(X[my_members, 0], X[my_members, 1], markers[k], color=col)
    plt.plot(
        cluster_center[0],
        cluster_center[1],
        markers[k],
        markerfacecolor=col,
        markeredgecolor="k",
        markersize=14,
    )
plt.title("Estimated number of clusters: %d" % n_clusters_)
plt.show()
Total running time of the script: (0分0.355秒)
相关实例

Gallery generated by Sphinx-Gallery <https://sphinx-gallery.github.io> _