备注
Go to the end 下载完整的示例代码。或者通过浏览器中的MysterLite或Binder运行此示例
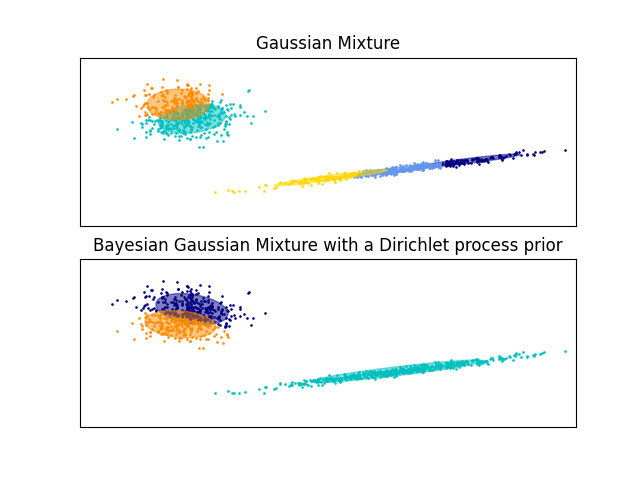
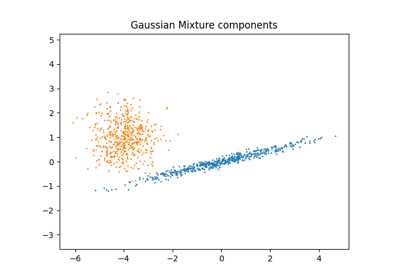
高斯混合模型椭圆体#
Plot the confidence ellipsoids of a mixture of two Gaussians
obtained with Expectation Maximisation (GaussianMixture class) and
Variational Inference (BayesianGaussianMixture class models with
a Dirichlet process prior).
这两个模型都可以访问五个组件来匹配数据。请注意,期望最大化模型必须使用所有五个成分,而变分推理模型实际上只使用良好匹配所需的成分。在这里,我们可以看到期望最大化模型任意拆分了一些组件,因为它试图适应太多的组件,而狄利克雷过程模型则自动调整其状态数。
这个例子没有显示出来,因为我们在低维空间中,但Dirichlet过程模型的另一个优点是,即使每个集群的示例少于数据中的维度,它也可以有效地适应完整的协方差矩阵,由于推理算法的规则化属性。
/xpy/lib/python3.11/site-packages/sklearn/mixture/_base.py:269: ConvergenceWarning:

Best performing initialization did not converge. Try different init parameters, or increase max_iter, tol, or check for degenerate data.
# Authors: The scikit-learn developers
# SPDX-License-Identifier: BSD-3-Clause

import itertools

import matplotlib as mpl
import matplotlib.pyplot as plt
import numpy as np
from scipy import linalg

from sklearn import mixture

color_iter = itertools.cycle(["navy", "c", "cornflowerblue", "gold", "darkorange"])


def plot_results(X, Y_, means, covariances, index, title):
    splot = plt.subplot(2, 1, 1 + index)
    for i, (mean, covar, color) in enumerate(zip(means, covariances, color_iter)):
        v, w = linalg.eigh(covar)
        v = 2.0 * np.sqrt(2.0) * np.sqrt(v)
        u = w[0] / linalg.norm(w[0])
        # as the DP will not use every component it has access to
        # unless it needs it, we shouldn't plot the redundant
        # components.
        if not np.any(Y_ == i):
            continue
        plt.scatter(X[Y_ == i, 0], X[Y_ == i, 1], 0.8, color=color)

        # Plot an ellipse to show the Gaussian component
        angle = np.arctan(u[1] / u[0])
        angle = 180.0 * angle / np.pi  # convert to degrees
        ell = mpl.patches.Ellipse(mean, v[0], v[1], angle=180.0 + angle, color=color)
        ell.set_clip_box(splot.bbox)
        ell.set_alpha(0.5)
        splot.add_artist(ell)

    plt.xlim(-9.0, 5.0)
    plt.ylim(-3.0, 6.0)
    plt.xticks(())
    plt.yticks(())
    plt.title(title)


# Number of samples per component
n_samples = 500

# Generate random sample, two components
np.random.seed(0)
C = np.array([[0.0, -0.1], [1.7, 0.4]])
X = np.r_[
    np.dot(np.random.randn(n_samples, 2), C),
    0.7 * np.random.randn(n_samples, 2) + np.array([-6, 3]),
]

# Fit a Gaussian mixture with EM using five components
gmm = mixture.GaussianMixture(n_components=5, covariance_type="full").fit(X)
plot_results(X, gmm.predict(X), gmm.means_, gmm.covariances_, 0, "Gaussian Mixture")

# Fit a Dirichlet process Gaussian mixture using five components
dpgmm = mixture.BayesianGaussianMixture(n_components=5, covariance_type="full").fit(X)
plot_results(
    X,
    dpgmm.predict(X),
    dpgmm.means_,
    dpgmm.covariances_,
    1,
    "Bayesian Gaussian Mixture with a Dirichlet process prior",
)

plt.show()
Total running time of the script: (0分0.221秒)
相关实例
Gallery generated by Sphinx-Gallery <https://sphinx-gallery.github.io> _