备注
Go to the end 下载完整的示例代码。或者通过浏览器中的MysterLite或Binder运行此示例
k均值初始化影响的实证评估#
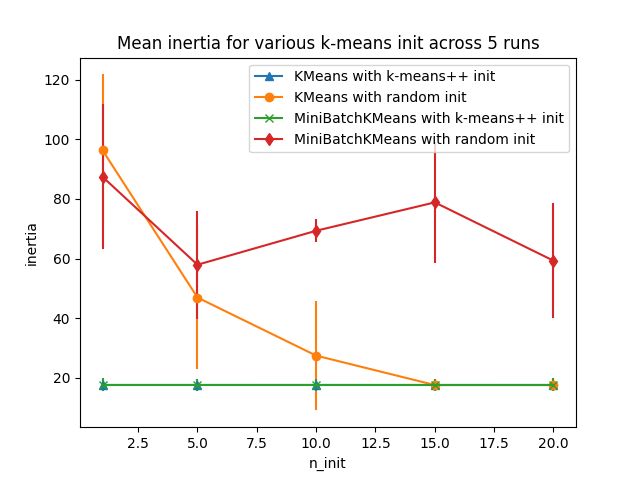
评估k均值初始化策略使算法收敛稳健的能力,通过集群惯性的相对标准差(即到最近的集群中心距离的平方和)来衡量。
第一个图显示模型的每个组合达到的最佳惯性 (KMeans 或 MiniBatchKMeans ),以及初始化方法 (init="random" 或 init="k-means++" )为了增加 n_init 控制初始化次数的参数。
The second plot demonstrates one single run of the MiniBatchKMeans
estimator using a init="random" and n_init=1. This run leads to
a bad convergence (local optimum), with estimated centers stuck
between ground truth clusters.
用于评估的数据集是间隔很广的各向同性高斯集群的2D网格。

Evaluation of KMeans with k-means++ init
Evaluation of KMeans with random init
Evaluation of MiniBatchKMeans with k-means++ init
Evaluation of MiniBatchKMeans with random init
# Authors: The scikit-learn developers
# SPDX-License-Identifier: BSD-3-Clause

import matplotlib.cm as cm
import matplotlib.pyplot as plt
import numpy as np

from sklearn.cluster import KMeans, MiniBatchKMeans
from sklearn.utils import check_random_state, shuffle

random_state = np.random.RandomState(0)

# Number of run (with randomly generated dataset) for each strategy so as
# to be able to compute an estimate of the standard deviation
n_runs = 5

# k-means models can do several random inits so as to be able to trade
# CPU time for convergence robustness
n_init_range = np.array([1, 5, 10, 15, 20])

# Datasets generation parameters
n_samples_per_center = 100
grid_size = 3
scale = 0.1
n_clusters = grid_size**2


def make_data(random_state, n_samples_per_center, grid_size, scale):
    random_state = check_random_state(random_state)
    centers = np.array([[i, j] for i in range(grid_size) for j in range(grid_size)])
    n_clusters_true, n_features = centers.shape

    noise = random_state.normal(
        scale=scale, size=(n_samples_per_center, centers.shape[1])
    )

    X = np.concatenate([c + noise for c in centers])
    y = np.concatenate([[i] * n_samples_per_center for i in range(n_clusters_true)])
    return shuffle(X, y, random_state=random_state)


# Part 1: Quantitative evaluation of various init methods


plt.figure()
plots = []
legends = []

cases = [
    (KMeans, "k-means++", {}, "^-"),
    (KMeans, "random", {}, "o-"),
    (MiniBatchKMeans, "k-means++", {"max_no_improvement": 3}, "x-"),
    (MiniBatchKMeans, "random", {"max_no_improvement": 3, "init_size": 500}, "d-"),
]

for factory, init, params, format in cases:
    print("Evaluation of %s with %s init" % (factory.__name__, init))
    inertia = np.empty((len(n_init_range), n_runs))

    for run_id in range(n_runs):
        X, y = make_data(run_id, n_samples_per_center, grid_size, scale)
        for i, n_init in enumerate(n_init_range):
            km = factory(
                n_clusters=n_clusters,
                init=init,
                random_state=run_id,
                n_init=n_init,
                **params,
            ).fit(X)
            inertia[i, run_id] = km.inertia_
    p = plt.errorbar(
        n_init_range, inertia.mean(axis=1), inertia.std(axis=1), fmt=format
    )
    plots.append(p[0])
    legends.append("%s with %s init" % (factory.__name__, init))

plt.xlabel("n_init")
plt.ylabel("inertia")
plt.legend(plots, legends)
plt.title("Mean inertia for various k-means init across %d runs" % n_runs)

# Part 2: Qualitative visual inspection of the convergence

X, y = make_data(random_state, n_samples_per_center, grid_size, scale)
km = MiniBatchKMeans(
    n_clusters=n_clusters, init="random", n_init=1, random_state=random_state
).fit(X)

plt.figure()
for k in range(n_clusters):
    my_members = km.labels_ == k
    color = cm.nipy_spectral(float(k) / n_clusters, 1)
    plt.plot(X[my_members, 0], X[my_members, 1], ".", c=color)
    cluster_center = km.cluster_centers_[k]
    plt.plot(
        cluster_center[0],
        cluster_center[1],
        "o",
        markerfacecolor=color,
        markeredgecolor="k",
        markersize=6,
    )
    plt.title(
        "Example cluster allocation with a single random init\nwith MiniBatchKMeans"
    )

plt.show()
Total running time of the script: (0分1.063秒)
相关实例

Gallery generated by Sphinx-Gallery <https://sphinx-gallery.github.io> _