备注
Go to the end 下载完整的示例代码。或者通过浏览器中的MysterLite或Binder运行此示例
因子分析(旋转)以可视化模式#
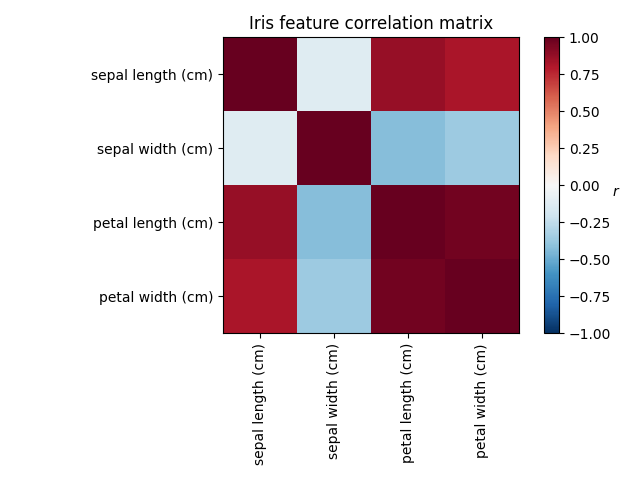
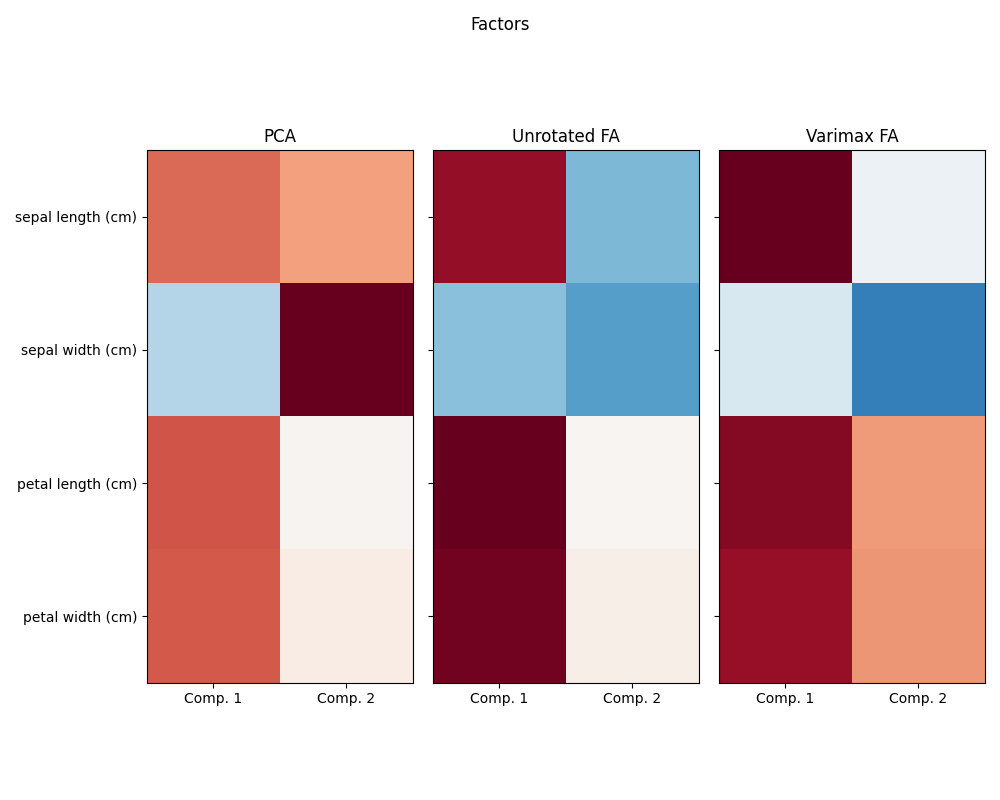
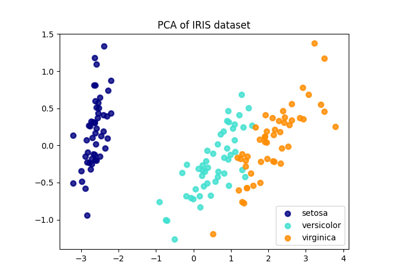
研究Iris数据集,我们发现花饰长度、花瓣长度和花瓣宽度高度相关。花瓣宽度不那么多余。矩阵分解技术可以揭示这些潜在的模式。将旋转应用于生成的分量并不会本质上提高派生潜在空间的预测值,但可以帮助可视化其结构;例如,在这里,通过最大化权重的平方方差来找到的可变最大旋转,找到第二个分量仅在花瓣宽度上正加载的结构。
# Authors: The scikit-learn developers
# SPDX-License-Identifier: BSD-3-Clause

import matplotlib.pyplot as plt
import numpy as np

from sklearn.datasets import load_iris
from sklearn.decomposition import PCA, FactorAnalysis
from sklearn.preprocessing import StandardScaler
加载Iris数据
data = load_iris()
X = StandardScaler().fit_transform(data["data"])
feature_names = data["feature_names"]
绘制虹膜特征的协方差
ax = plt.axes()

im = ax.imshow(np.corrcoef(X.T), cmap="RdBu_r", vmin=-1, vmax=1)

ax.set_xticks([0, 1, 2, 3])
ax.set_xticklabels(list(feature_names), rotation=90)
ax.set_yticks([0, 1, 2, 3])
ax.set_yticklabels(list(feature_names))

plt.colorbar(im).ax.set_ylabel("$r$", rotation=0)
ax.set_title("Iris feature correlation matrix")
plt.tight_layout()
使用方差最大旋转运行因子分析
n_comps = 2

methods = [
    ("PCA", PCA()),
    ("Unrotated FA", FactorAnalysis()),
    ("Varimax FA", FactorAnalysis(rotation="varimax")),
]
fig, axes = plt.subplots(ncols=len(methods), figsize=(10, 8), sharey=True)

for ax, (method, fa) in zip(axes, methods):
    fa.set_params(n_components=n_comps)
    fa.fit(X)

    components = fa.components_.T
    print("\n\n %s :\n" % method)
    print(components)

    vmax = np.abs(components).max()
    ax.imshow(components, cmap="RdBu_r", vmax=vmax, vmin=-vmax)
    ax.set_yticks(np.arange(len(feature_names)))
    ax.set_yticklabels(feature_names)
    ax.set_title(str(method))
    ax.set_xticks([0, 1])
    ax.set_xticklabels(["Comp. 1", "Comp. 2"])
fig.suptitle("Factors")
plt.tight_layout()
plt.show()
 PCA :

[[ 0.52106591  0.37741762]
 [-0.26934744  0.92329566]
 [ 0.5804131   0.02449161]
 [ 0.56485654  0.06694199]]


 Unrotated FA :

[[ 0.88096009 -0.4472869 ]
 [-0.41691605 -0.55390036]
 [ 0.99918858  0.01915283]
 [ 0.96228895  0.05840206]]


 Varimax FA :

[[ 0.98633022 -0.05752333]
 [-0.16052385 -0.67443065]
 [ 0.90809432  0.41726413]
 [ 0.85857475  0.43847489]]
Total running time of the script: (0分0.296秒)
相关实例
Gallery generated by Sphinx-Gallery <https://sphinx-gallery.github.io> _