备注
Go to the end 下载完整的示例代码。或者通过浏览器中的MysterLite或Binder运行此示例
光谱协同聚集算法的演示#
此示例演示了如何使用光谱协同集群算法生成数据集并对其进行双集群。
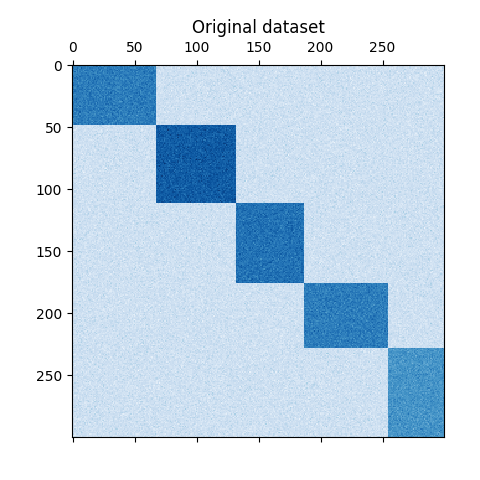
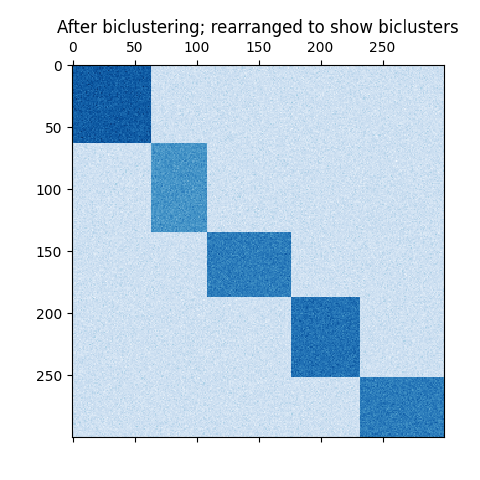
数据集是使用 make_biclusters 函数,该函数创建一个小值矩阵,并使用大值植入双聚类。然后将行和列进行混洗并传递到光谱共聚类算法。重新排列混洗矩阵以使双聚类连续显示算法找到双聚类的准确性。

consensus score: 1.000
# Authors: The scikit-learn developers
# SPDX-License-Identifier: BSD-3-Clause

import numpy as np
from matplotlib import pyplot as plt

from sklearn.cluster import SpectralCoclustering
from sklearn.datasets import make_biclusters
from sklearn.metrics import consensus_score

data, rows, columns = make_biclusters(
    shape=(300, 300), n_clusters=5, noise=5, shuffle=False, random_state=0
)

plt.matshow(data, cmap=plt.cm.Blues)
plt.title("Original dataset")

# shuffle clusters
rng = np.random.RandomState(0)
row_idx = rng.permutation(data.shape[0])
col_idx = rng.permutation(data.shape[1])
data = data[row_idx][:, col_idx]

plt.matshow(data, cmap=plt.cm.Blues)
plt.title("Shuffled dataset")

model = SpectralCoclustering(n_clusters=5, random_state=0)
model.fit(data)
score = consensus_score(model.biclusters_, (rows[:, row_idx], columns[:, col_idx]))

print("consensus score: {:.3f}".format(score))

fit_data = data[np.argsort(model.row_labels_)]
fit_data = fit_data[:, np.argsort(model.column_labels_)]

plt.matshow(fit_data, cmap=plt.cm.Blues)
plt.title("After biclustering; rearranged to show biclusters")

plt.show()
Total running time of the script: (0分0.253秒)
相关实例

Gallery generated by Sphinx-Gallery <https://sphinx-gallery.github.io> _