备注
Go to the end 下载完整的示例代码。或者通过浏览器中的MysterLite或Binder运行此示例
使用多任务Lasso进行联合特征选择#
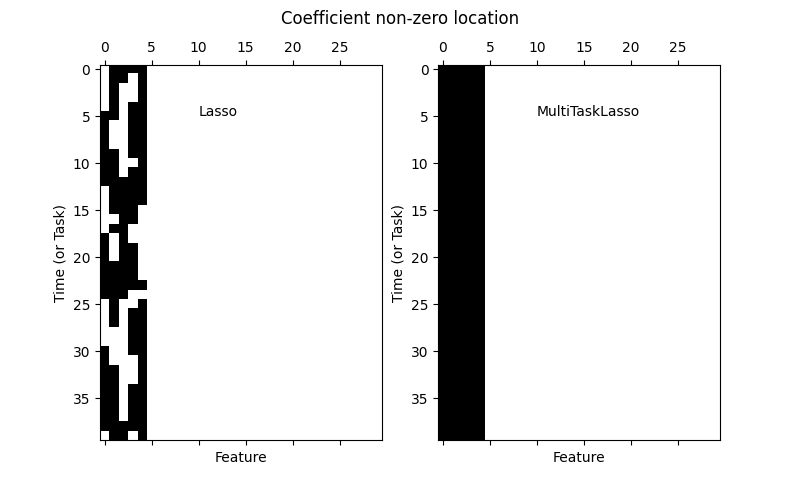
多任务套索允许拟合多个回归问题,联合强制所选特征在任务之间相同。这个例子模拟了连续的测量,每个任务都是一个时刻,相关的特征在相同的情况下随着时间的推移而在幅度上变化。多任务套索强制在一个时间点选择的特征在所有时间点都被选择。这使得Lasso的特征选择更加稳定。
# Authors: The scikit-learn developers
# SPDX-License-Identifier: BSD-3-Clause
生成数据#
import numpy as np

rng = np.random.RandomState(42)

# Generate some 2D coefficients with sine waves with random frequency and phase
n_samples, n_features, n_tasks = 100, 30, 40
n_relevant_features = 5
coef = np.zeros((n_tasks, n_features))
times = np.linspace(0, 2 * np.pi, n_tasks)
for k in range(n_relevant_features):
    coef[:, k] = np.sin((1.0 + rng.randn(1)) * times + 3 * rng.randn(1))

X = rng.randn(n_samples, n_features)
Y = np.dot(X, coef.T) + rng.randn(n_samples, n_tasks)
试衣模特#
from sklearn.linear_model import Lasso, MultiTaskLasso

coef_lasso_ = np.array([Lasso(alpha=0.5).fit(X, y).coef_ for y in Y.T])
coef_multi_task_lasso_ = MultiTaskLasso(alpha=1.0).fit(X, Y).coef_
情节支持和时间序列#
import matplotlib.pyplot as plt
fig = plt.figure(figsize=(8, 5))
plt.subplot(1, 2, 1)
plt.spy(coef_lasso_)
plt.xlabel("Feature")
plt.ylabel("Time (or Task)")
plt.text(10, 5, "Lasso")
plt.subplot(1, 2, 2)
plt.spy(coef_multi_task_lasso_)
plt.xlabel("Feature")
plt.ylabel("Time (or Task)")
plt.text(10, 5, "MultiTaskLasso")
fig.suptitle("Coefficient non-zero location")
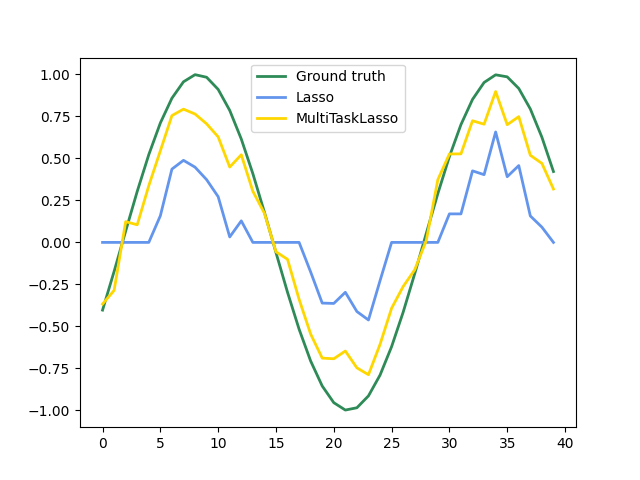
feature_to_plot = 0
plt.figure()
lw = 2
plt.plot(coef[:, feature_to_plot], color="seagreen", linewidth=lw, label="Ground truth")
plt.plot(
coef_lasso_[:, feature_to_plot], color="cornflowerblue", linewidth=lw, label="Lasso"
)
plt.plot(
coef_multi_task_lasso_[:, feature_to_plot],
color="gold",
linewidth=lw,
label="MultiTaskLasso",
)
plt.legend(loc="upper center")
plt.axis("tight")
plt.ylim([-1.1, 1.1])
plt.show()
Total running time of the script: (0分0.153秒)
相关实例

Gallery generated by Sphinx-Gallery <https://sphinx-gallery.github.io> _