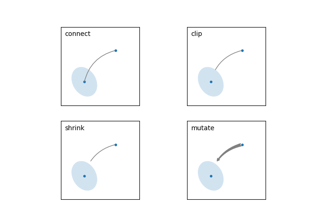
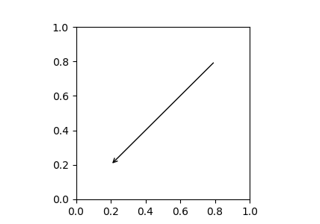
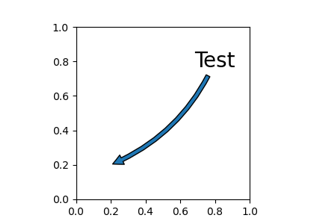
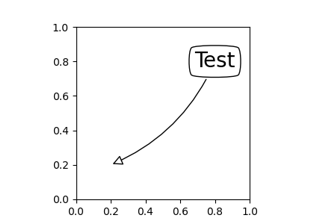
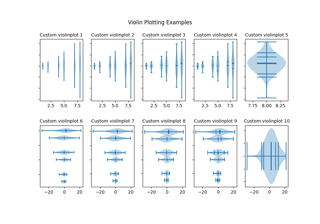
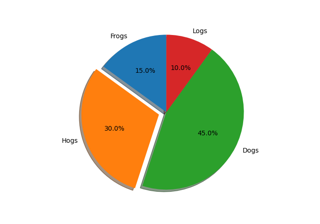
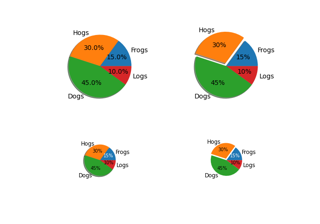
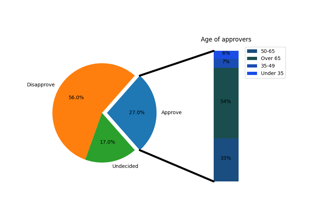
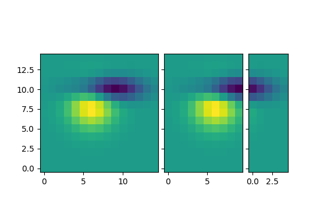
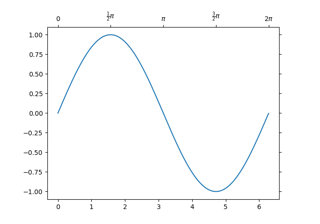
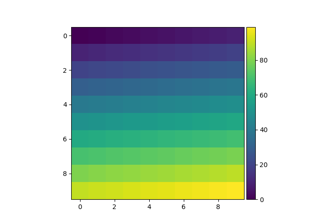
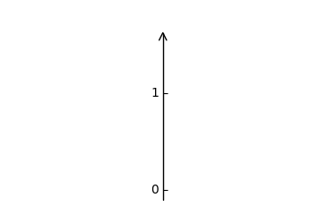
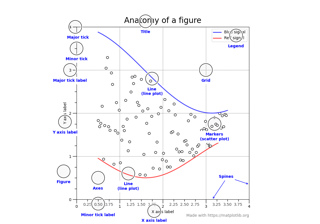
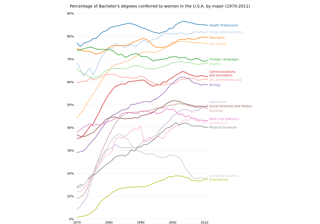
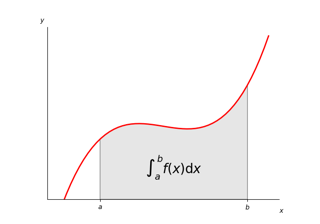
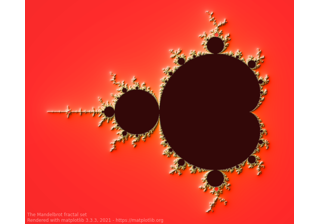
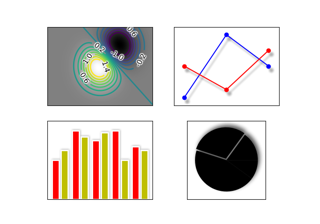
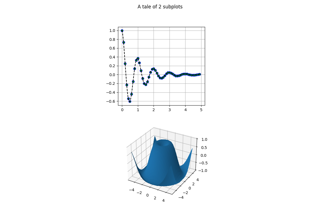
绘图示例
这个图库包含了许多可以使用matplotlib执行的操作的示例。单击任何图像以查看完整图像和源代码。
有关更长的教程,请参阅 tutorials page . 你也可以找到 external resources 和A FAQ 在我们 user guide .


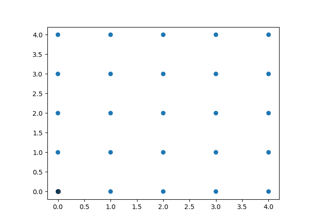
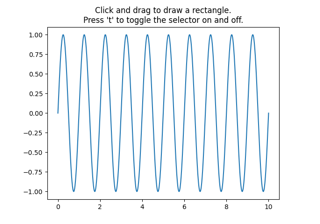
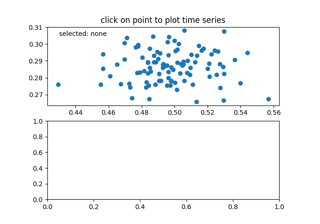
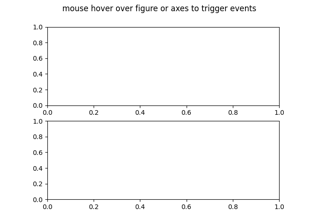
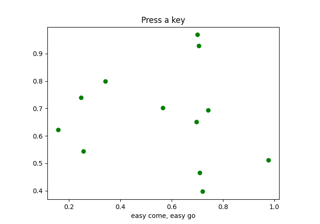
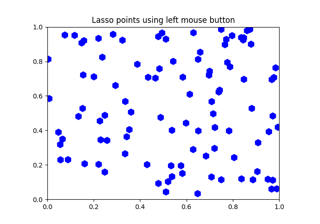
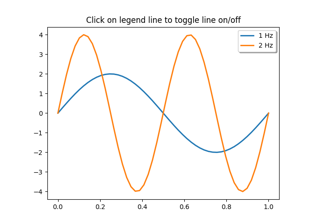
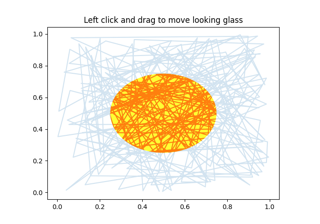
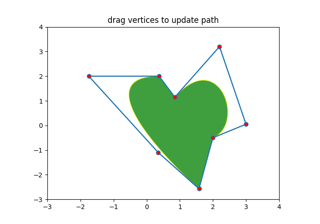
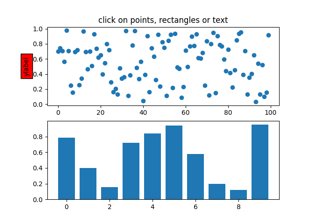
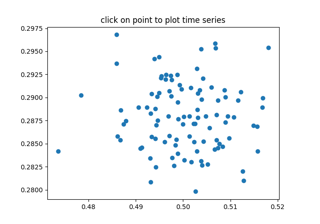
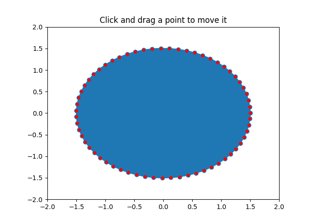
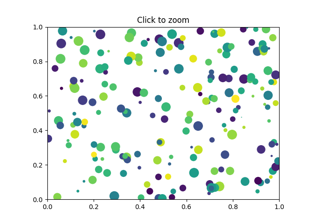
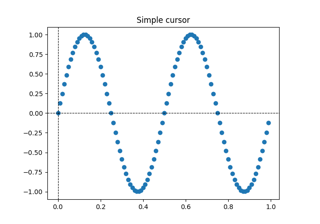
事件处理
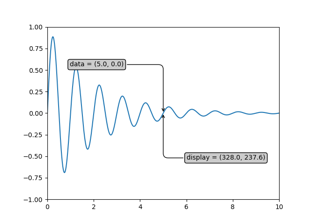
Matplotlib支架 event handling 使用一个与GUI无关的事件模型,您可以连接到Matplotlib事件,而不知道Matplotlib最终将插入什么用户界面。这有两个优点:您编写的代码更易于移植,Matplotlib事件知道数据坐标空间以及事件发生在哪个轴上,因此您不必为从画布空间到数据空间的低级转换细节而烦恼。还包括对象选取示例。


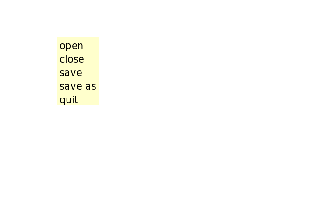
在图形用户界面中嵌入matplotlib
您可以按照下面的“在somegui.py中嵌入”示例,将matplotlib直接嵌入到用户界面应用程序中。目前matplotlib支持wxpython、pygtk、tkinter和pyqt4/5。
在GUI中嵌入matplotlib时,必须直接使用matplotlib API,而不是pylab/pyplot proceedural接口,因此请查看examples/api目录中使用该API的一些示例代码。