注解
Click here 下载完整的示例代码
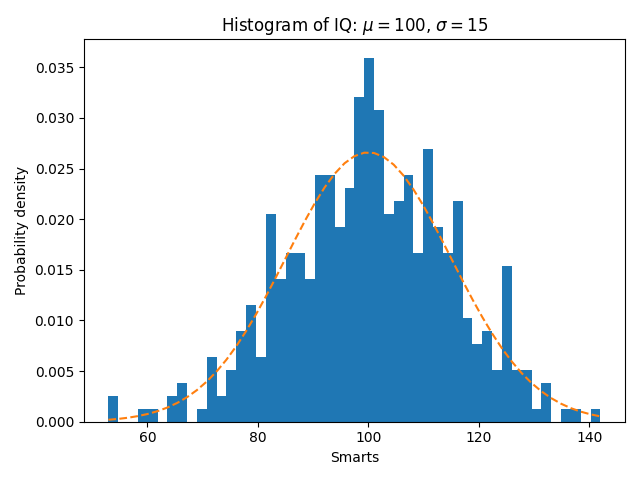
直方图(hist)函数的一些特征
除了基本的柱状图之外,本演示还显示了一些可选功能:
- 设置数据箱的数量。
- 这个 密度 参数,用于规范化箱子高度,以便直方图的积分为1。得到的直方图是概率密度函数的近似值。
- 设置条的面颜色。
- 设置不透明度(alpha值)。
选择不同的仓位计数和大小会显著影响直方图的形状。占星术医生有一个伟大的 section 关于如何选择这些参数。
import matplotlib
import numpy as np
import matplotlib.pyplot as plt

np.random.seed(19680801)

# example data
mu = 100  # mean of distribution
sigma = 15  # standard deviation of distribution
x = mu + sigma * np.random.randn(437)

num_bins = 50

fig, ax = plt.subplots()

# the histogram of the data
n, bins, patches = ax.hist(x, num_bins, density=True)

# add a 'best fit' line
y = ((1 / (np.sqrt(2 * np.pi) * sigma)) *
     np.exp(-0.5 * (1 / sigma * (bins - mu))**2))
ax.plot(bins, y, '--')
ax.set_xlabel('Smarts')
ax.set_ylabel('Probability density')
ax.set_title(r'Histogram of IQ: $\mu=100$, $\sigma=15$')

# Tweak spacing to prevent clipping of ylabel
fig.tight_layout()
plt.show()
工具书类
本例中显示了以下函数和方法的使用:
出:
<function Axes.set_ylabel at 0x7faa00db22f0>
关键词:matplotlib代码示例,codex,python plot,pyplot Gallery generated by Sphinx-Gallery