注解
Click here 下载完整的示例代码
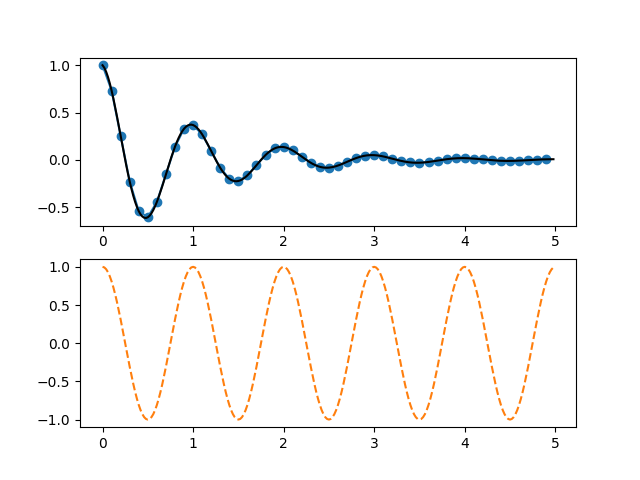
绘制两个子图
创建带有两个子图的图形 pyplot.subplot .
import numpy as np
import matplotlib.pyplot as plt


def f(t):
    return np.exp(-t) * np.cos(2*np.pi*t)


t1 = np.arange(0.0, 5.0, 0.1)
t2 = np.arange(0.0, 5.0, 0.02)

plt.figure()
plt.subplot(211)
plt.plot(t1, f(t1), color='tab:blue', marker='o')
plt.plot(t2, f(t2), color='black')

plt.subplot(212)
plt.plot(t2, np.cos(2*np.pi*t2), color='tab:orange', linestyle='--')
plt.show()
工具书类
以下函数、方法、类和模块的使用如本例所示:
import matplotlib
matplotlib.pyplot.figure
matplotlib.pyplot.subplot
出:
<function subplot at 0x7faa00ce1268>
关键词:matplotlib代码示例,codex,python plot,pyplot Gallery generated by Sphinx-Gallery