matplotlib.pyplot.subplot
-
matplotlib.pyplot.subplot(*args, **kwargs)[源代码]¶ 在当前图形中添加子批次。
包装材料
Figure.add_subplot在“注释”一节中解释了不同的行为。呼叫签名:
subplot(nrows, ncols, index, **kwargs)
subplot(pos, **kwargs)
subplot(**kwargs)
subplot(ax)
参数: - *args :int,(int,int, 指数 )
SubplotSpec,默认值:(1,1,1)内特,(内特,内特, 其中一个描述的子图的位置
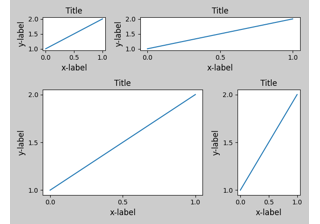
- 三个整数( 诺尔斯 , 恩科斯 , 指数 ). 子地块将接受 指数 在网格上的位置 诺尔斯 行和 恩科斯 柱。 指数 从左上角的1开始,向右增加。 指数 也可以是指定( 第一 , last )指数(以1为基础,包括 last )子地块的,例如。,
fig.add_subplot(3, 1, (1, 2))生成一个子图,该子图跨越图形的上2/3。 - 三位整数。这些数字被解释为三个独立的整数,即。
fig.add_subplot(235)是一样的fig.add_subplot(2, 3, 5). 请注意,仅当子批次不超过9个时,才可以使用此选项。 - A
SubplotSpec.
- 三个整数( 诺尔斯 , 恩科斯 , 指数 ). 子地块将接受 指数 在网格上的位置 诺尔斯 行和 恩科斯 柱。 指数 从左上角的1开始,向右增加。 指数 也可以是指定( 第一 , last )指数(以1为基础,包括 last )子地块的,例如。,
- projection无,'aitoff'、'hammer'、'lambert'、'mollweide'、'polar'、'rectlinear'、str,可选
子批次的投影类型 (
Axes) str 是自定义投影的名称,请参见projections. 默认的“无”将导致“直线”投影。- polarbool,默认值:False
如果为真,则相当于投影='polar'。
- 斯莱西 :
Axes可选可选轴 共享X或Y
axis使用sharex和/或sharey。轴将具有与共享轴的轴相同的限制、刻度和比例。- labelSTR
返回轴的标签。
返回: axes.SubplotBase, or another subclass ofAxes子批次的轴。返回的axes基类取决于使用的投影。它是
Axes如果使用直线投影projections.polar.PolarAxes如果使用极轴投影。然后,返回的轴是基类的子批子类。
其他参数: - **kwargs
此方法还接受返回的Axis基类的关键字参数;除了 图形 争论。直线基类的关键字参数
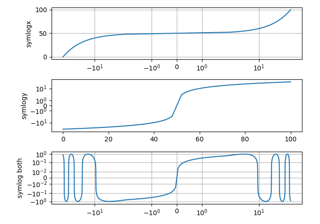
Axes可以在下表中找到,但如果使用其他投影,也可能存在其他关键字参数。财产 描述 adjustable'box'、'datalim' agg_filter一种过滤函数,它接受一个(m,n,3)浮点数组和一个dpi值,并返回一个(m,n,3)数组。 alpha浮动或无 anchor2-浮点数或'c'、'sw'、's'、'se'、… animated布尔 aspect{auto}或num autoscale_on布尔 autoscalex_on布尔 autoscaley_on布尔 axes_locator可赎回的 [[轴,渲染器]] Bbox axisbelow布尔或“线” box_aspect没有,或者是一个数字 clip_boxBboxclip_on布尔 clip_path面片或(路径、变换)或无 contains未知的 facecolor或fc颜色 figureFigureframe_on布尔 gidSTR in_layout布尔 label对象 navigate布尔 navigate_mode未知的 path_effectsAbstractPathEffectpicker无、布尔或可呼叫 position[左、下、宽、高] 或 Bboxprop_cycle未知的 rasterization_zorder浮动或无 rasterized布尔或无 sketch_params(比例:浮动,长度:浮动,随机性:浮动) snap布尔或无 titleSTR transformTransformurlSTR visible布尔 xbound未知的 xlabelSTR xlim(底部:浮动,顶部:浮动) xmargin浮动大于-0.5 xscale“Linear”,“Log”,“SymLog”,“Logit”,… xticklabels未知的 xticks未知的 ybound未知的 ylabelSTR ylim(底部:浮动,顶部:浮动) ymargin浮动大于-0.5 yscale“Linear”,“Log”,“SymLog”,“Logit”,… yticklabels未知的 yticks未知的 zorder浮动
笔记
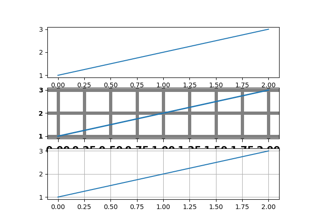
创建子批次将删除与之重叠的任何现有子批次(超出共享边界)::
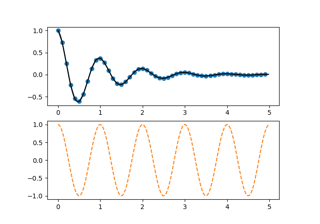
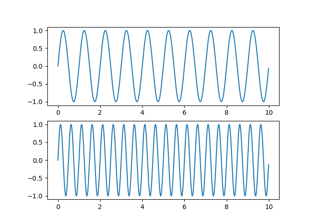
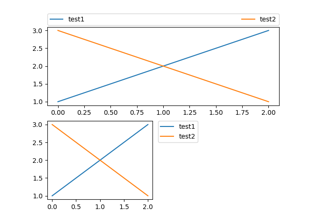
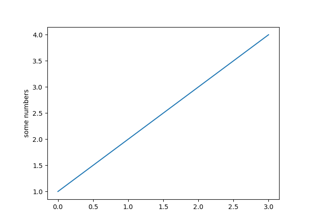
import matplotlib.pyplot as plt
# plot a line, implicitly creating a subplot(111)
plt.plot([1, 2, 3])
# now create a subplot which represents the top plot of a grid
# with 2 rows and 1 column. Since this subplot will overlap the
# first, the plot (and its axes) previously created, will be removed
plt.subplot(211)
如果不希望此行为,请使用
Figure.add_subplot方法或pyplot.axes而是函数。如果数字已经有带键的子批次( args , 关键字参数 )然后它将简单地将该子批次置为当前并返回它。此行为已弃用。同时,如果您不希望这种行为(即,您想强制创建一个新的子批次),则必须使用一组唯一的arg和kwarg。轴 标签 为此,已公开了属性:如果要将两个相同的子批次添加到图中,请确保为它们提供唯一的标签。
在极少数情况下,
add_subplot可以用单个参数调用,子批次轴实例已在当前图中创建,但不在图的轴列表中。实例
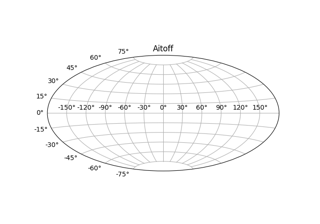
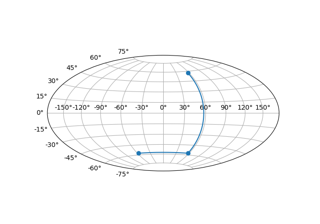
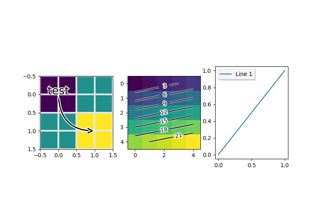
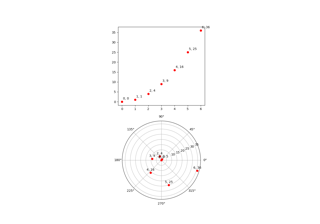
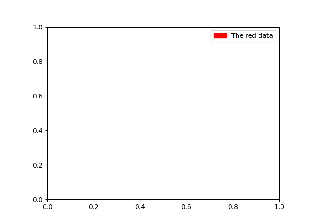
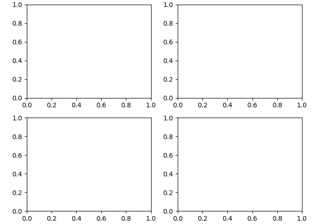
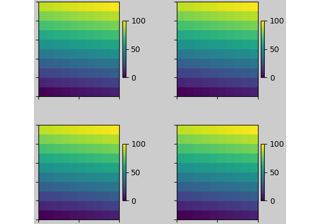
plt.subplot(221)

# equivalent but more general
ax1=plt.subplot(2, 2, 1)

# add a subplot with no frame
ax2=plt.subplot(222, frameon=False)

# add a polar subplot
plt.subplot(223, projection='polar')

# add a red subplot that shares the x-axis with ax1
plt.subplot(224, sharex=ax1, facecolor='red')

# delete ax2 from the figure
plt.delaxes(ax2)

# add ax2 to the figure again
plt.subplot(ax2)
- *args :int,(int,int, 指数 )