注解
Click here 下载完整的示例代码
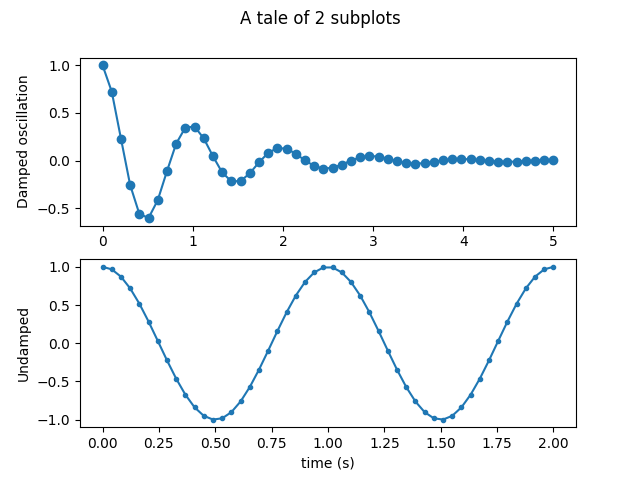
多个子批次
带有多个子批次的简单演示。
import numpy as np
import matplotlib.pyplot as plt
x1 = np.linspace(0.0, 5.0)
x2 = np.linspace(0.0, 2.0)

y1 = np.cos(2 * np.pi * x1) * np.exp(-x1)
y2 = np.cos(2 * np.pi * x2)

fig, (ax1, ax2) = plt.subplots(2, 1)
fig.suptitle('A tale of 2 subplots')

ax1.plot(x1, y1, 'o-')
ax1.set_ylabel('Damped oscillation')

ax2.plot(x2, y2, '.-')
ax2.set_xlabel('time (s)')
ax2.set_ylabel('Undamped')

plt.show()
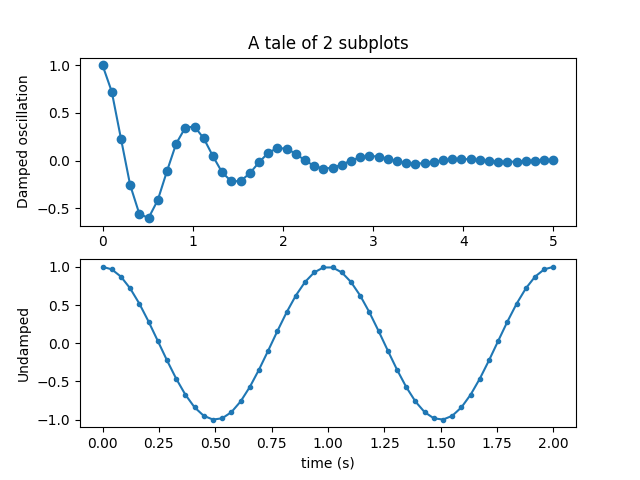
创建多个绘图的替代方法
子图也可以使用 subplot() 如下例所示:
x1 = np.linspace(0.0, 5.0)
x2 = np.linspace(0.0, 2.0)

y1 = np.cos(2 * np.pi * x1) * np.exp(-x1)
y2 = np.cos(2 * np.pi * x2)

plt.subplot(2, 1, 1)
plt.plot(x1, y1, 'o-')
plt.title('A tale of 2 subplots')
plt.ylabel('Damped oscillation')

plt.subplot(2, 1, 2)
plt.plot(x2, y2, '.-')
plt.xlabel('time (s)')
plt.ylabel('Undamped')

plt.show()
脚本的总运行时间: (0分1.019秒)
关键词:matplotlib代码示例,codex,python plot,pyplot Gallery generated by Sphinx-Gallery