matplotlib.axes
matplotlib.axes.Axes.set_xticks
Axes.
set_xticks
设置X轴的刻度位置。
勾选位置列表。
如果 False ,设置主刻度;如果 True ,小滴答声。
False
True
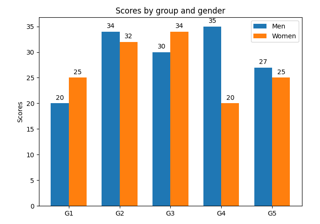
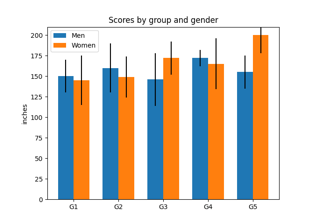
带标签的分组条形图
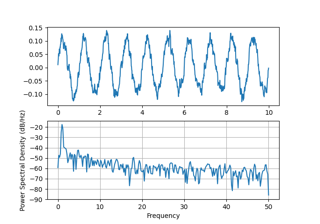
PSD演示
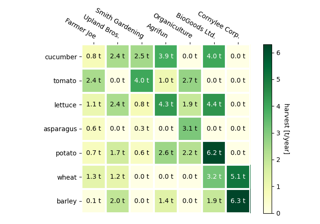
创建带注释的热图
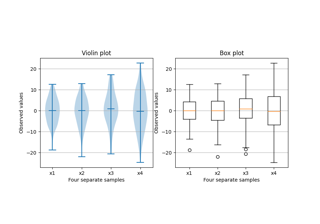
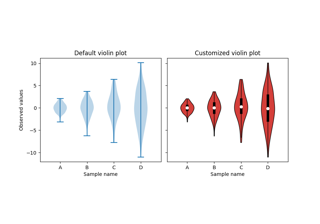
盒图与小提琴图比较
小提琴绘图定制
并排生成多个柱状图
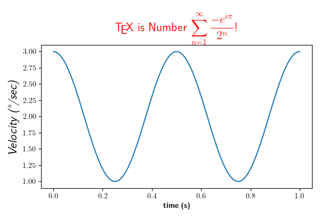
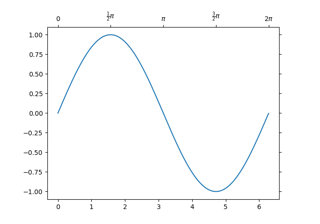
用TeX绘制数学方程
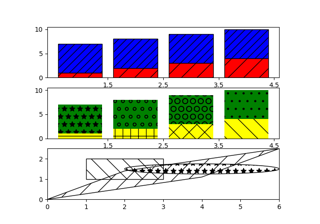
舱口演示
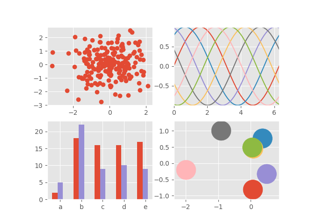
ggplot样式表
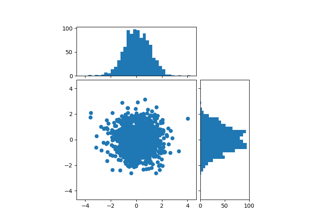
散点直方图(可定位轴)
简单轴线4
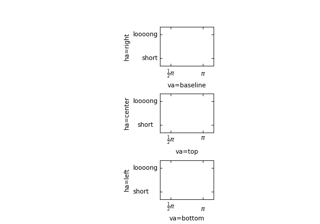
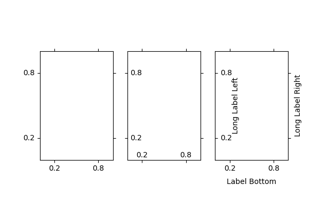
演示TickLabel对齐
演示TickLabel方向
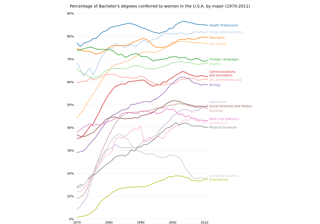
按性别划分的学士学位
火狐
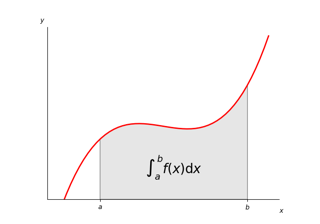
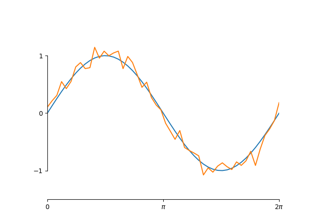
积分为曲线下的面积
阴影和功率标准化渲染
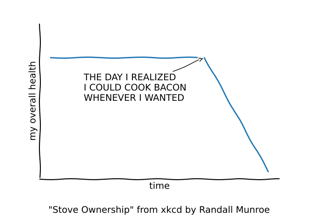
XKCD
模拟降雨
MATPLOTLIB UNCHAINED
FrontPage 3D示例
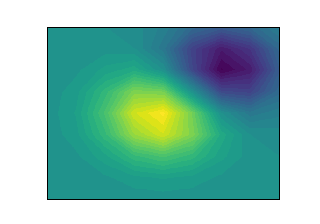
FrontPage轮廓示例
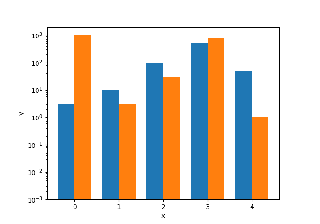
FrontPage柱状图示例
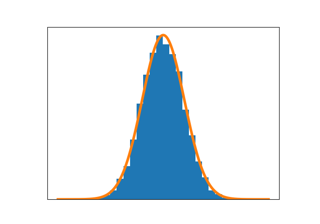
FrontPage绘图示例
原木杆
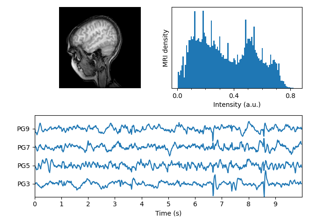
磁共振脑电图
自定义脊椎边界
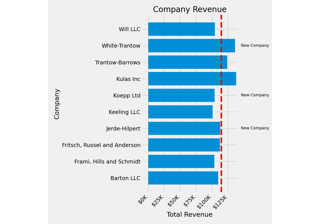
用单位对条形图分组
图的生命周期