注解
Click here 下载完整的示例代码
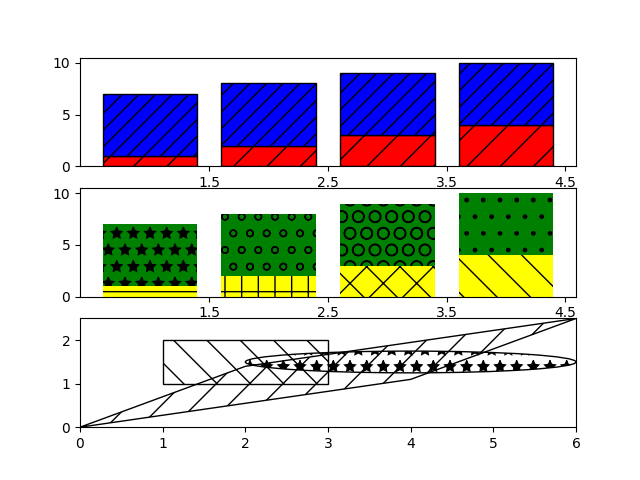
舱口演示
图案填充多边形目前仅在PS、PDF、SVG和AGG后端支持。
import matplotlib.pyplot as plt
from matplotlib.patches import Ellipse, Polygon

fig, (ax1, ax2, ax3) = plt.subplots(3)

ax1.bar(range(1, 5), range(1, 5), color='red', edgecolor='black', hatch="/")
ax1.bar(range(1, 5), [6] * 4, bottom=range(1, 5),
        color='blue', edgecolor='black', hatch='//')
ax1.set_xticks([1.5, 2.5, 3.5, 4.5])

bars = ax2.bar(range(1, 5), range(1, 5), color='yellow', ecolor='black') + \
    ax2.bar(range(1, 5), [6] * 4, bottom=range(1, 5),
            color='green', ecolor='black')
ax2.set_xticks([1.5, 2.5, 3.5, 4.5])

patterns = ('-', '+', 'x', '\\', '*', 'o', 'O', '.')
for bar, pattern in zip(bars, patterns):
    bar.set_hatch(pattern)

ax3.fill([1, 3, 3, 1], [1, 1, 2, 2], fill=False, hatch='\\')
ax3.add_patch(Ellipse((4, 1.5), 4, 0.5, fill=False, hatch='*'))
ax3.add_patch(Polygon([[0, 0], [4, 1.1], [6, 2.5], [2, 1.4]], closed=True,
                      fill=False, hatch='/'))
ax3.set_xlim((0, 6))
ax3.set_ylim((0, 2.5))

plt.show()
工具书类
以下函数、方法、类和模块的使用如本例所示:
出:
<function bar at 0x7faa00cf8e18>
关键词:matplotlib代码示例,codex,python plot,pyplot Gallery generated by Sphinx-Gallery