matplotlib.axes
matplotlib.axes.Axes.add_patch
Axes.
add_patch
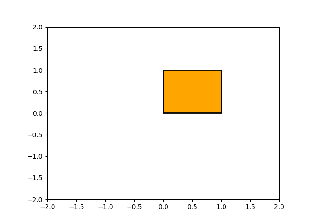
添加 Patch 到轴的补丁;返回补丁。
Patch
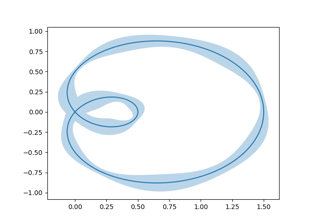
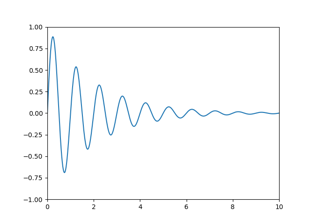
带误差带的曲线
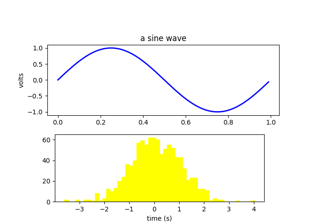
图像演示
轴盒纵横比
使用边距和粘滞边缘控制视图限制
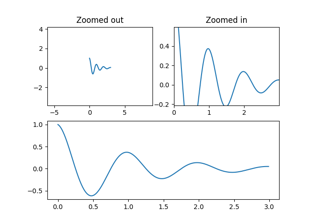
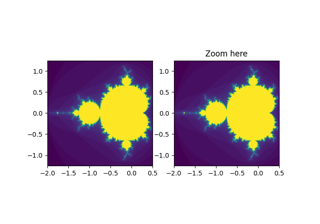
轴缩放效果
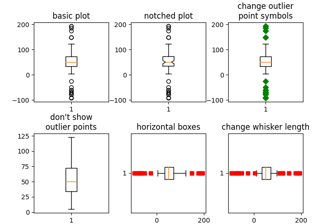
箱形图
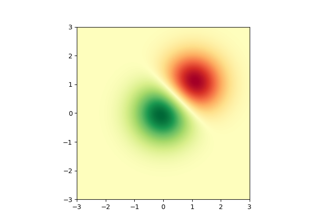
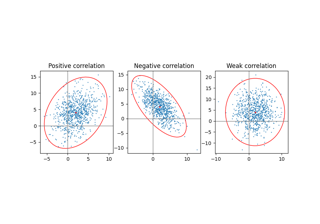
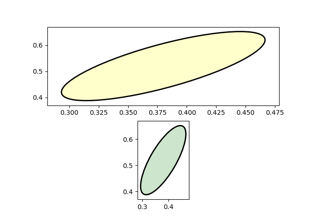
绘制二维数据集的置信椭圆
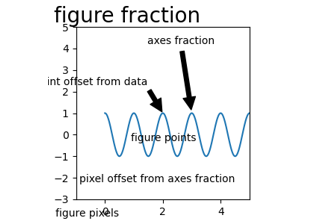
注释绘图
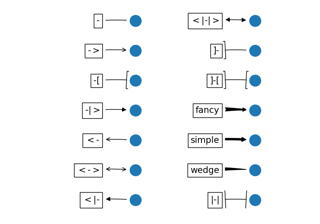
范奇亚罗演示
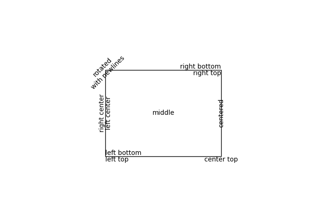
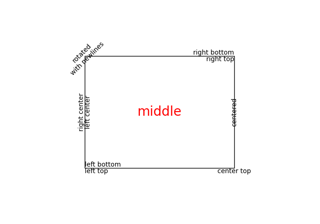
精确文本布局
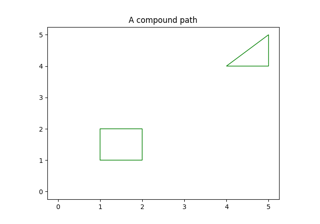
复合路径
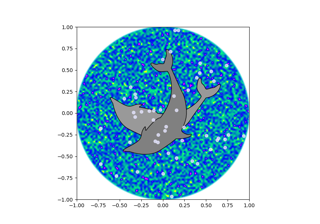
海豚
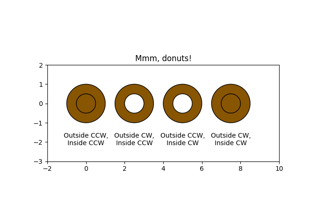
MMH甜甜圈!!!!
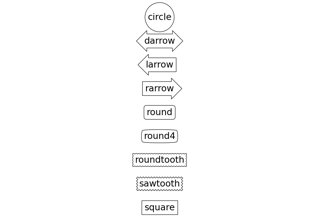
画漂亮的盒子
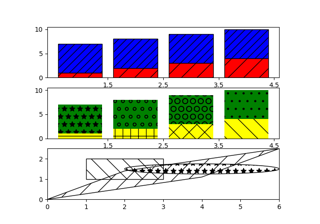
舱口演示
PathPatch对象
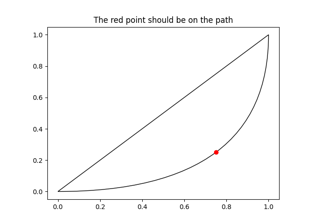
贝塞尔曲线
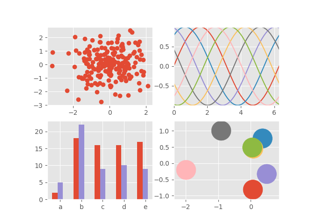
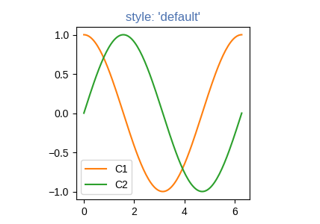
ggplot样式表
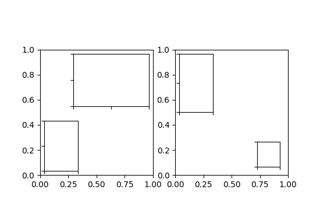
插入定位器演示
火狐
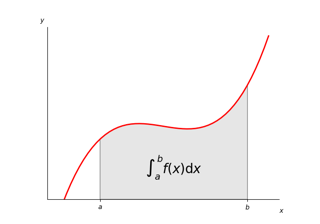
积分为曲线下的面积
动画柱状图
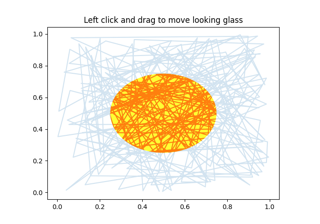
看格拉斯
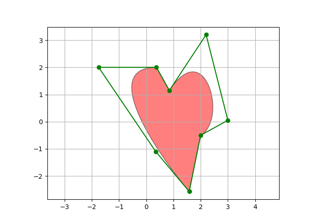
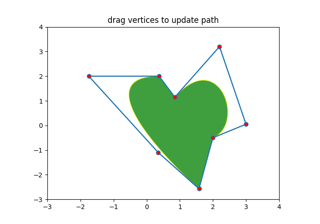
路径编辑器
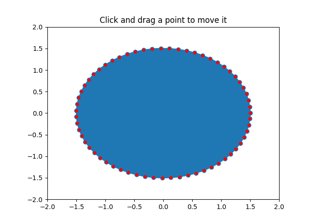
多边形编辑器
视界
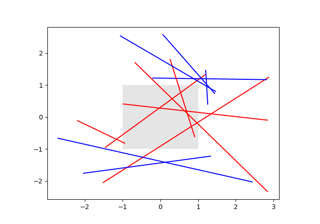
更改与方框相交的线条的颜色
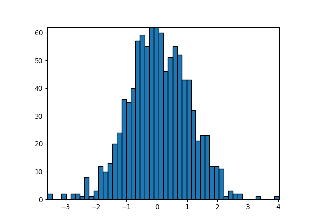
使用矩形和多集合构建柱状图
SVG滤饼
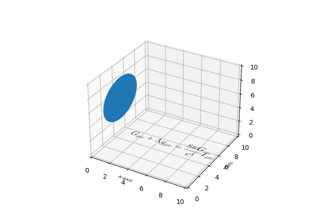
在三维绘图中绘制平面对象
艺术家测试
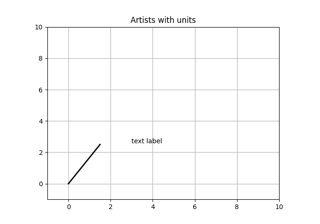
带单位的椭圆
艺术家辅导
路径教程
转换教程
指定颜色
文本属性和布局