注解
Click here 下载完整的示例代码
艺术家辅导
使用艺术家对象在画布上渲染。
Matplotlib API有三层。
- 这个
matplotlib.backend_bases.FigureCanvas是图形绘制的区域吗? - 这个
matplotlib.backend_bases.Renderer是知道如何在FigureCanvas - 以及
matplotlib.artist.Artist是知道如何使用渲染器在画布上绘制的对象。
这个 FigureCanvas 和 Renderer 处理与用户界面工具包交谈的所有细节,如 wxPython 或绘图语言,如PostScript®和 Artist 处理所有高级构造,如表示和布局图形、文本和线条。典型的用户将花费95%的时间使用 Artists .
有两种类型 Artists :基本体和容器。基本体表示我们要在画布上绘制的标准图形对象: Line2D , Rectangle , Text , AxesImage 等等,容器是放置它们的地方。 (Axis , Axes 和 Figure )标准用途是创建 Figure 实例,使用 Figure 创建一个或多个 Axes 或 Subplot 实例,并使用 Axes 用于创建基元的实例帮助器方法。在下面的示例中,我们创建一个 Figure 实例使用 matplotlib.pyplot.figure() 这是一种方便的实例化方法 Figure 实例并将其与用户界面或绘图工具包连接 FigureCanvas . 正如我们将在下面讨论的,这是不必要的——您可以直接使用PostScript、PDF GTK+或Wxpython。 FigureCanvas 实例,实例化 Figures 直接联系他们自己——但是因为我们在这里关注的是 Artist 我们会让API pyplot 为我们处理这些细节:
import matplotlib.pyplot as plt
fig = plt.figure()
ax = fig.add_subplot(2, 1, 1) # two rows, one column, first plot
这个 Axes 可能是MatplotlibAPI中最重要的类,并且大多数时候您将使用它。这是因为 Axes 是大多数对象进入的绘图区域,并且 Axes 有许多特殊的助手方法 (plot() , text() , hist() , imshow() )创建最常见的图形基本体 (Line2D , Text , Rectangle , AxesImage ,分别)。这些帮助器方法将获取您的数据(例如, numpy 数组和字符串)并创建基元 Artist 需要时的实例(例如, Line2D )将它们添加到相关容器中,并在需要时绘制它们。你们大多数人可能都熟悉 Subplot ,这只是 Axes 按列排列的规则行 Subplot 实例。如果要创建 Axes 在任意位置,只需使用 add_axes() 方法的列表 [left, bottom, width, height] 0-1相对图形坐标中的值:
fig2 = plt.figure()
ax2 = fig2.add_axes([0.15, 0.1, 0.7, 0.3])
继续我们的示例:
在这个例子中, ax is the Axes instance created by the fig.add_subplot call above (remember Subplot is just a subclass of Axes) and when you call ax.plot, it creates a Line2D instance and adds it to the Axes.lines list. In the interactive ipython session below, you can see that the Axes.lines list is length one and contains the same line that was returned by the line, = ax.plot... 呼叫:
In [101]: ax.lines[0]
Out[101]: <matplotlib.lines.Line2D instance at 0x19a95710>

In [102]: line
Out[102]: <matplotlib.lines.Line2D instance at 0x19a95710>
如果您以后打电话给 ax.plot (并且保持状态为“开”,这是默认值),那么将向列表中添加其他行。稍后只需调用list方法即可删除行;这两种方法都可以:
del ax.lines[0]
ax.lines.remove(line)  # one or the other, not both!
轴还具有辅助方法来配置和装饰X轴和Y轴刻度、刻度标签和轴标签:
xtext = ax.set_xlabel('my xdata') # returns a Text instance
ytext = ax.set_ylabel('my ydata')
当你打电话 ax.set_xlabel ,它传递 Text 实例 XAxis . 各 Axes 实例包含 XAxis 和A YAxis 实例,用于处理刻度、刻度标签和轴标签的布局和绘图。
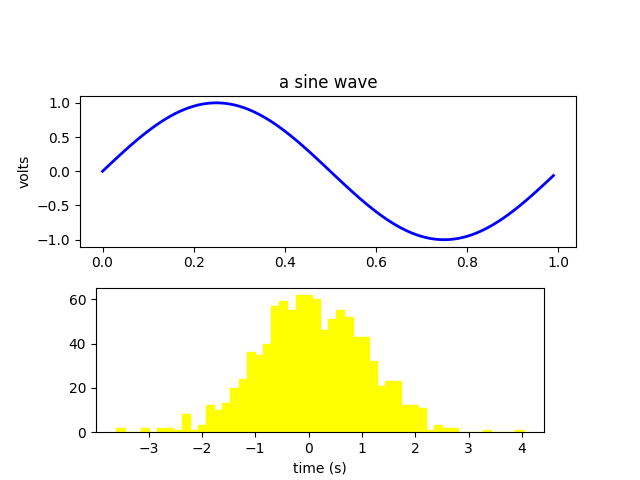
尝试创建下图。
import numpy as np
import matplotlib.pyplot as plt

fig = plt.figure()
fig.subplots_adjust(top=0.8)
ax1 = fig.add_subplot(211)
ax1.set_ylabel('volts')
ax1.set_title('a sine wave')

t = np.arange(0.0, 1.0, 0.01)
s = np.sin(2*np.pi*t)
line, = ax1.plot(t, s, color='blue', lw=2)

# Fixing random state for reproducibility
np.random.seed(19680801)

ax2 = fig.add_axes([0.15, 0.1, 0.7, 0.3])
n, bins, patches = ax2.hist(np.random.randn(1000), 50,
                            facecolor='yellow', edgecolor='yellow')
ax2.set_xlabel('time (s)')

plt.show()
自定义对象
图中的每个元素都由matplotlib表示 Artist ,并且每个属性都有一个广泛的属性列表来配置其外观。数字本身包含 Rectangle 正好是图形的大小,您可以使用它来设置图形的背景色和透明度。同样,每个 Axes 边界框(典型matplotlib图中带黑色边缘的标准白色框,具有 Rectangle 确定轴的颜色、透明度和其他属性的实例。这些实例存储为成员变量 Figure.patch 和 Axes.patch (“patch”是从matlab继承的名称,是图形上颜色的二维“patch”,例如矩形、圆形和多边形)。每个Matplotlib Artist 具有以下属性
| 财产 | 描述 |
|---|---|
| 阿尔法 | 透明度-从0到1的标量 |
| 有生气的 | 用于促进动画绘制的布尔值。 |
| 轴线 | 艺术家居住的斧子,可能没有。 |
| clip_box | 剪辑艺术家的边界框 |
| clip_on | 是否启用剪辑 |
| clip_path | 艺术家被剪辑到的路径 |
| 包含 | 用于测试艺术家是否包含拾取点的拾取函数 |
| 图形 | 艺术家居住的人物实例,可能没有。 |
| 标签 | 文本标签(例如,用于自动标签) |
| 捡拾器 | 控制对象拾取的python对象 |
| 转型 | 转型 |
| 看得见的 | 是否应绘制该艺术家的布尔值 |
| Z阶 | 决定绘图顺序的数字 |
| 栅格化 | 布尔值;将矢量转换为栅格图形(用于压缩和eps透明度) |
每个属性都是通过一个老式的setter或getter访问的(是的,我们知道这会激怒pythonistas,我们计划通过属性或特性支持直接访问,但还没有完成)。例如,将当前alpha乘以一半:
a = o.get_alpha()
o.set_alpha(0.5*a)
如果要一次设置多个属性,也可以使用 set 具有关键字参数的方法。例如::
o.set(alpha=0.5, zorder=2)
如果您在python shell上进行交互工作,则是检查 Artist 属性是使用 matplotlib.artist.getp() 功能(简单 getp() 在pyplot中),它列出了属性及其值。这适用于派生自 Artist 同样,例如, Figure 和 Rectangle . 这里是 Figure 上面提到的矩形属性:
In [149]: matplotlib.artist.getp(fig.patch)
    alpha = 1.0
    animated = False
    antialiased or aa = True
    axes = None
    clip_box = None
    clip_on = False
    clip_path = None
    contains = None
    edgecolor or ec = w
    facecolor or fc = 0.75
    figure = Figure(8.125x6.125)
    fill = 1
    hatch = None
    height = 1
    label =
    linewidth or lw = 1.0
    picker = None
    transform = <Affine object at 0x134cca84>
    verts = ((0, 0), (0, 1), (1, 1), (1, 0))
    visible = True
    width = 1
    window_extent = <Bbox object at 0x134acbcc>
    x = 0
    y = 0
    zorder = 1
所有类的docStrings还包含 Artist 属性,以便您可以参考交互式“帮助”或 matplotlib.artist 获取给定对象的属性列表。
对象容器
既然我们知道了如何检查和设置要配置的给定对象的属性,那么我们就需要知道如何获取该对象。正如在引言中提到的,有两种对象:原语和容器。基本体通常是您想要配置的内容(字体 Text 例如,A的宽度 Line2D )尽管容器也有一些属性——例如 Axes Artist 是一个容器,其中包含绘图中的许多基元,但它也具有类似 xscale 控制xaxis是“线性”还是“对数”。在本节中,我们将回顾各种容器对象存储 Artists 你想得到的。
图容器
顶层容器 Artist 是 matplotlib.figure.Figure 它包含了图中的所有内容。图的背景是 Rectangle 存储在 Figure.patch . 添加子批次时 (add_subplot() 和轴 (add_axes() )在图中,这些将附加到 Figure.axes . 这些也由创建它们的方法返回:
In [156]: fig = plt.figure()

In [157]: ax1 = fig.add_subplot(211)

In [158]: ax2 = fig.add_axes([0.1, 0.1, 0.7, 0.3])

In [159]: ax1
Out[159]: <matplotlib.axes.Subplot instance at 0xd54b26c>

In [160]: print(fig.axes)
[<matplotlib.axes.Subplot instance at 0xd54b26c>,
<matplotlib.axes.Axes instance at 0xd3f0b2c>]
因为图形保持了“当前轴”的概念(请参见 Figure.gca 和 Figure.sca )要支持pylab/pyplot状态机,不应直接从轴列表中插入或删除轴,而是使用 add_subplot() 和 add_axes() 插入方法,以及 delaxes() 要删除的方法。但是,您可以自由地遍历轴列表或索引以访问 Axes 要自定义的实例。以下是打开所有轴网格的示例:
for ax in fig.axes:
    ax.grid(True)
图形也有自己的文本、线条、面片和图像,您可以使用它们直接添加基本体。的默认坐标系 Figure 将以像素为单位(这通常不是您想要的),但您可以通过设置 Artist 你在增加这个数字。
更有用的是“图形坐标”,其中(0,0)是图形的左下角,(1,1)是图形的右上角,可以通过设置 Artist 转化为 fig.transFigure :
import matplotlib.lines as lines

fig = plt.figure()

l1 = lines.Line2D([0, 1], [0, 1], transform=fig.transFigure, figure=fig)
l2 = lines.Line2D([0, 1], [1, 0], transform=fig.transFigure, figure=fig)
fig.lines.extend([l1, l2])

plt.show()

这是这个数字所包含的艺术家的摘要
| 图形属性 | 描述 |
|---|---|
| 轴线 | 轴实例列表(包括子批次) |
| 补丁 | 矩形背景 |
| 图像 | FigureImage补丁列表-用于原始像素显示 |
| 传说 | 图形图例实例列表(不同于axes.legents) |
| 线 | Figure Line2d实例列表(很少使用,请参见axes.lines) |
| 补片 | 图形补丁列表(很少使用,请参见axes.patches) |
| 课文 | 列表图文本实例 |
轴容器
这个 matplotlib.axes.Axes 是Matplotlib宇宙的中心——它包含了 Artists 在包含许多辅助方法的图形中用于创建和添加这些 Artists 以及用于访问和自定义 Artists 它包含。像 Figure 它包含一个 Patch patch 哪个是 Rectangle 对于笛卡尔坐标和 Circle 对于极坐标,此补丁决定绘图区域的形状、背景和边界:
ax = fig.add_subplot(111)
rect = ax.patch  # a Rectangle instance
rect.set_facecolor('green')
当调用绘图方法时,例如 plot() 并传入数组或值列表,该方法将创建 matplotlib.lines.Line2D() 实例,用所有 Line2D 属性作为关键字参数传递,将行添加到 Axes.lines 容器,并返回给您:
In [213]: x, y = np.random.rand(2, 100)

In [214]: line, = ax.plot(x, y, '-', color='blue', linewidth=2)
plot 返回一个行列表,因为您可以将多个x,y对传递给绘图,我们将把length one列表的第一个元素解包到line变量中。该行已添加到 Axes.lines 名单:
In [229]: print(ax.lines)
[<matplotlib.lines.Line2D instance at 0xd378b0c>]
类似地,创建补丁的方法 bar() 创建矩形列表,将修补程序添加到 Axes.patches 名单:
In [233]: n, bins, rectangles = ax.hist(np.random.randn(1000), 50)

In [234]: rectangles
Out[234]: <a list of 50 Patch objects>

In [235]: print(len(ax.patches))
不应将对象直接添加到 Axes.lines 或 Axes.patches 除非你确切知道你在做什么,因为 Axes 在创建和添加对象时需要做一些事情。它设置 Artist 以及默认值 Axes 转换(除非设置了转换)。它还检查 Artist 更新控制自动缩放的数据结构,以便可以调整视图限制以包含绘制的数据。但是,您可以自己创建对象,并将它们直接添加到 Axes 使用像这样的辅助方法 add_line() 和 add_patch() . 下面是一个带注释的交互式会话,说明正在发生的事情:
In [262]: fig, ax = plt.subplots()

# create a rectangle instance
In [263]: rect = matplotlib.patches.Rectangle((1, 1), width=5, height=12)

# by default the axes instance is None
In [264]: print(rect.axes)
None

# and the transformation instance is set to the "identity transform"
In [265]: print(rect.get_transform())
<Affine object at 0x13695544>

# now we add the Rectangle to the Axes
In [266]: ax.add_patch(rect)

# and notice that the ax.add_patch method has set the axes
# instance
In [267]: print(rect.axes)
Axes(0.125,0.1;0.775x0.8)

# and the transformation has been set too
In [268]: print(rect.get_transform())
<Affine object at 0x15009ca4>

# the default axes transformation is ax.transData
In [269]: print(ax.transData)
<Affine object at 0x15009ca4>

# notice that the xlimits of the Axes have not been changed
In [270]: print(ax.get_xlim())
(0.0, 1.0)

# but the data limits have been updated to encompass the rectangle
In [271]: print(ax.dataLim.bounds)
(1.0, 1.0, 5.0, 12.0)

# we can manually invoke the auto-scaling machinery
In [272]: ax.autoscale_view()

# and now the xlim are updated to encompass the rectangle
In [273]: print(ax.get_xlim())
(1.0, 6.0)

# we have to manually force a figure draw
In [274]: ax.figure.canvas.draw()
有很多,很多 Axes 用于创建基元的帮助器方法 Artists 并将其添加到各自的容器中。下表总结了它们的一小部分样本,即 Artist 它们创建并存储它们
| 辅助方法 | 艺术家 | 集装箱 |
|---|---|---|
| ax.annotate-文本注释 | 注释 | ax.texts |
| ax.条形图 | 矩形 | ax.patches |
| Ax.ErrorBar-错误条形图 | 线条2d和矩形 | ax.lines和ax.patches |
| ax.fill-共享区域 | Polygon | ax.patches |
| ax.hist-柱状图 | 矩形 | ax.patches |
| ax.imshow-图像数据 | AxesImage | ax.images |
| 轴图例-轴图例 | 传说 | ax.legends |
| ax.图-xy图 | 线2D | ax.lines |
| 最大散点图 | PolygonCollection | ax.collections |
| AX.文本-文本 | 文本 | ax.texts |
除了所有这些 Artists , the Axes 包含两个重要 Artist 集装箱: XAxis 和 YAxis ,用于处理刻度线和标签的绘制。它们存储为实例变量 xaxis 和 yaxis . 这个 XAxis 和 YAxis 容器将在下面详细说明,但请注意 Axes 包含许多将调用转发到 Axis 因此,除非您愿意,否则您通常不需要直接使用实例。例如,可以设置 XAxis 使用勾选标签 Axes 辅助方法:
for label in ax.get_xticklabels():
    label.set_color('orange')
下面是轴包含的艺术家的摘要
| 轴属性 | 描述 |
|---|---|
| 艺术家 | 艺术家实例列表 |
| 补丁 | 轴背景的矩形实例 |
| 收藏 | 集合实例列表 |
| 图像 | AXESIMAGE列表 |
| 传说 | 图例实例列表 |
| 线 | Line2d实例列表 |
| 补片 | 补丁实例列表 |
| 课文 | 文本实例列表 |
| X轴 | matplotlib.axis.xaxis实例 |
| 横轴 | matplotlib.axis.yaxis实例 |
轴容器
这个 matplotlib.axis.Axis 实例处理刻度线、网格线、刻度线标签和轴标签的绘制。您可以分别为Y轴配置左右勾号,为X轴配置上下勾号。这个 Axis 还存储自动缩放、平移和缩放中使用的数据和视图间隔,以及 Locator 和 Formatter 控制记号放置位置以及如何将其表示为字符串的实例。
各 Axis 对象包含 label 属性(这是 pyplot 在调用中修改 xlabel 和 ylabel )以及主要和次要刻度的列表。蜱类是 axis.XTick 和 axis.YTick 实例,其中包含渲染滴答和滴答标签的实际行和文本原语。因为记号是根据需要动态创建的(例如,平移和缩放时),所以应该通过其访问器方法访问主要和次要记号的列表。 axis.Axis.get_major_ticks 和 axis.Axis.get_minor_ticks . 虽然记号包含所有基本体,将在下面介绍, Axis 实例具有返回刻度线、刻度标签、刻度位置等的访问器方法:
fig, ax = plt.subplots()
axis = ax.xaxis
axis.get_ticklocs()
出:
array([0. , 0.2, 0.4, 0.6, 0.8, 1. ])
出:
[Text(0.0, 0, '0.0'), Text(0.2, 0, '0.2'), Text(0.4, 0, '0.4'), Text(0.6000000000000001, 0, '0.6'), Text(0.8, 0, '0.8'), Text(1.0, 0, '1.0')]
注意,标记线的数量是标签的两倍,因为默认情况下,在顶部和底部都有刻度线,但是只有x轴下方的刻度线标签;但是,这是可以自定义的。
出:
<a list of 12 Line2D ticklines objects>
使用上述方法,默认情况下只会返回主要刻度的列表,但也可以请求次要刻度:
axis.get_ticklabels(minor=True)
axis.get_ticklines(minor=True)
出:
<a list of 0 Line2D ticklines objects>
下面是的一些有用的访问器方法的摘要 Axis (在有用的情况下,它们具有相应的setter,例如 set_major_formatter() )
| 存取器方法 | 描述 |
|---|---|
| get_scale | 轴的刻度,例如“对数”或“线性” |
| get_view_interval | 轴视图限制的间隔实例 |
| get_data_interval | 轴数据限制的间隔实例 |
| get_gridlines | 轴的网格线列表 |
| get_label | 轴标签-文本实例 |
| get_ticklabels | 文本实例列表-关键字minor=True | False |
| get_ticklines | Line2D实例列表-关键字minor=True | False |
| get_ticklocs | 记号位置列表-关键字minor=True | False |
| get_major_locator | 这个 ticker.Locator 主要刻度实例 |
| get_major_formatter | 这个 ticker.Formatter 主要刻度实例 |
| get_minor_locator | 这个 ticker.Locator 小刻度实例 |
| get_minor_formatter | 这个 ticker.Formatter 小刻度实例 |
| get_major_ticks | 主要记号的记号实例列表 |
| get_minor_ticks | 次要记号的记号实例列表 |
| 网格 | 打开或关闭主要刻度或次要刻度的栅格 |
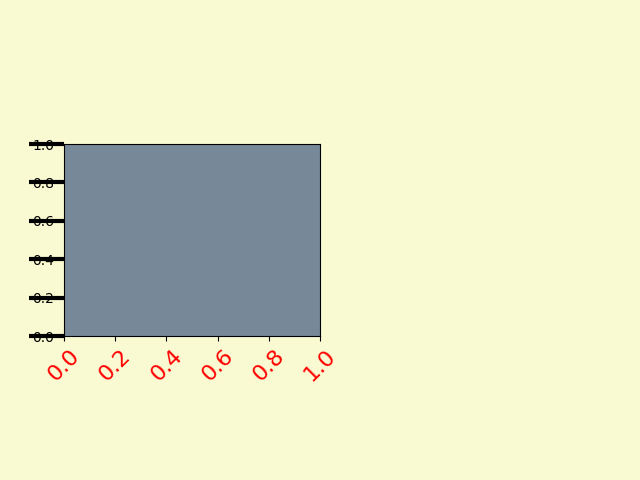
下面是一个示例,由于其美观性而不推荐使用,它自定义轴和记号属性
# plt.figure creates a matplotlib.figure.Figure instance
fig = plt.figure()
rect = fig.patch  # a rectangle instance
rect.set_facecolor('lightgoldenrodyellow')

ax1 = fig.add_axes([0.1, 0.3, 0.4, 0.4])
rect = ax1.patch
rect.set_facecolor('lightslategray')


for label in ax1.xaxis.get_ticklabels():
    # label is a Text instance
    label.set_color('red')
    label.set_rotation(45)
    label.set_fontsize(16)

for line in ax1.yaxis.get_ticklines():
    # line is a Line2D instance
    line.set_color('green')
    line.set_markersize(25)
    line.set_markeredgewidth(3)

plt.show()
滴答容器
这个 matplotlib.axis.Tick 是我们从 Figure 到 Axes 到 Axis 到 Tick . 这个 Tick 包含刻度线和网格线实例,以及上下刻度线的标签实例。其中每一个都可以作为 Tick .
| 蜱属性 | 描述 |
|---|---|
| TICK1线 | 线性2D实例 |
| Tik2线 | 线性2D实例 |
| 网格线 | 线性2D实例 |
| 标记1 | 文本实例 |
| 标签2 | 文本实例 |
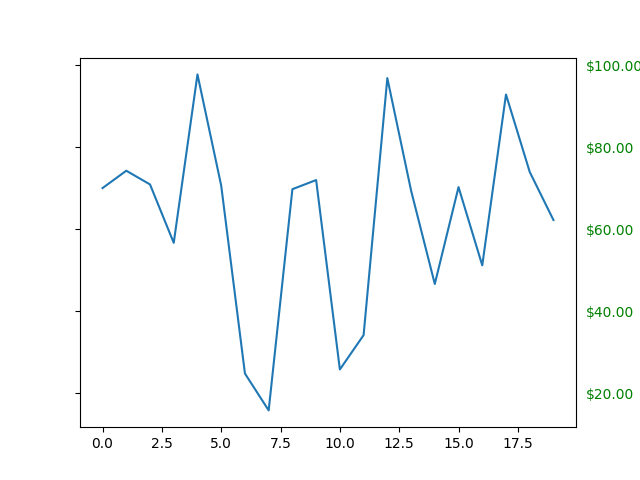
下面是一个示例,它使用美元符号设置右侧记号的格式设置器,并在Y轴的右侧将其涂成绿色。
import numpy as np
import matplotlib.pyplot as plt

# Fixing random state for reproducibility
np.random.seed(19680801)

fig, ax = plt.subplots()
ax.plot(100*np.random.rand(20))

# Use automatic StrMethodFormatter
ax.yaxis.set_major_formatter('${x:1.2f}')

ax.yaxis.set_tick_params(which='major', labelcolor='green',
                         labelleft=False, labelright=True)

plt.show()
脚本的总运行时间: (0分1.012秒)
关键词:matplotlib代码示例,codex,python plot,pyplot Gallery generated by Sphinx-Gallery