注解
Click here 下载完整的示例代码
带误差带的曲线
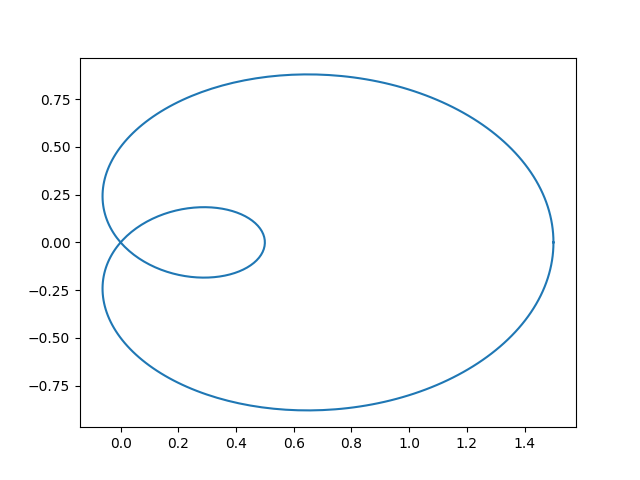
此示例演示如何围绕参数化曲线绘制误差带。
参数化曲线x(t),y(t)可以直接用 plot .
import numpy as np
from scipy.interpolate import splprep, splev

import matplotlib.pyplot as plt
from matplotlib.path import Path
from matplotlib.patches import PathPatch

N = 400
t = np.linspace(0, 2 * np.pi, N)
r = 0.5 + np.cos(t)
x, y = r * np.cos(t), r * np.sin(t)

fig, ax = plt.subplots()
ax.plot(x, y)
plt.show()
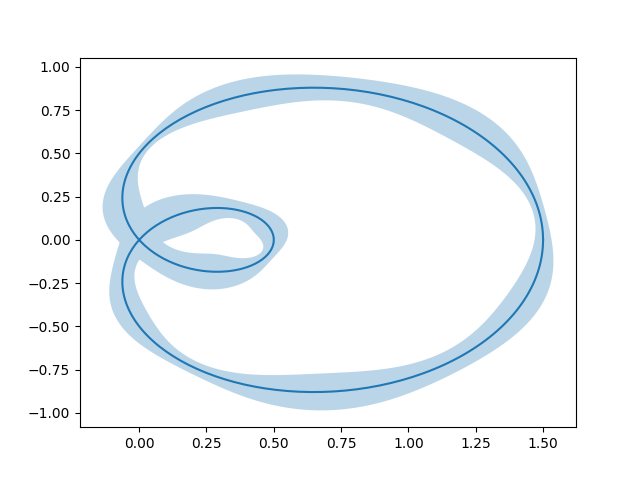
误差带可以用来表示曲线的不确定性。在这个例子中,我们假设错误可以用标量表示 err 它描述了垂直于曲线的每个点的不确定性。
我们将此错误可视化为使用 PathPatch . 面片由两个路径段创建 (xp,yp) 和 (新,新) 它们被+/- err 垂直于曲线 (x,y) .
注:此方法使用 PathPatch 适用于2D中的任意曲线。如果您只有一个标准的y-vs.-x绘图,您可以使用更简单的 fill_between 方法(另见 填充线条之间的区域 )
# Error amplitudes depending on the curve parameter *t*
# (actual values are arbitrary and only for illustrative purposes):
err = 0.05 * np.sin(2 * t) ** 2 + 0.04 + 0.02 * np.cos(9 * t + 2)

# calculate normals via derivatives of splines
tck, u = splprep([x, y], s=0)
dx, dy = splev(u, tck, der=1)
l = np.hypot(dx, dy)
nx = dy / l
ny = -dx / l

# end points of errors
xp = x + nx * err
yp = y + ny * err
xn = x - nx * err
yn = y - ny * err

vertices = np.block([[xp, xn[::-1]],
                     [yp, yn[::-1]]]).T
codes = Path.LINETO * np.ones(len(vertices), dtype=Path.code_type)
codes[0] = codes[len(xp)] = Path.MOVETO
path = Path(vertices, codes)

patch = PathPatch(path, facecolor='C0', edgecolor='none', alpha=0.3)

fig, ax = plt.subplots()
ax.plot(x, y)
ax.add_patch(patch)
plt.show()
工具书类
本例中显示了以下函数、方法和类的使用:
import matplotlib
matplotlib.patches.PathPatch
matplotlib.path.Path
关键词:matplotlib代码示例,codex,python plot,pyplot Gallery generated by Sphinx-Gallery