注解
Click here 下载完整的示例代码
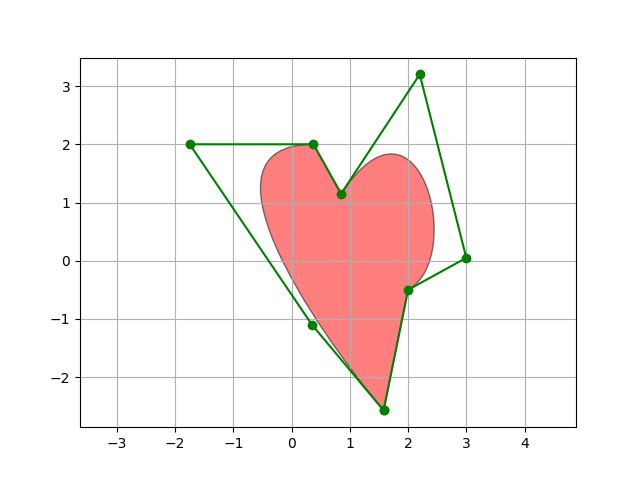
PathPatch对象
此示例演示如何创建 Path 和 PathPatch 对象通过Matplotlib的API。
import matplotlib.path as mpath
import matplotlib.patches as mpatches
import matplotlib.pyplot as plt

fig, ax = plt.subplots()

Path = mpath.Path
path_data = [
    (Path.MOVETO, (1.58, -2.57)),
    (Path.CURVE4, (0.35, -1.1)),
    (Path.CURVE4, (-1.75, 2.0)),
    (Path.CURVE4, (0.375, 2.0)),
    (Path.LINETO, (0.85, 1.15)),
    (Path.CURVE4, (2.2, 3.2)),
    (Path.CURVE4, (3, 0.05)),
    (Path.CURVE4, (2.0, -0.5)),
    (Path.CLOSEPOLY, (1.58, -2.57)),
    ]
codes, verts = zip(*path_data)
path = mpath.Path(verts, codes)
patch = mpatches.PathPatch(path, facecolor='r', alpha=0.5)
ax.add_patch(patch)

# plot control points and connecting lines
x, y = zip(*path.vertices)
line, = ax.plot(x, y, 'go-')

ax.grid()
ax.axis('equal')
plt.show()
工具书类
以下函数、方法、类和模块的使用如本例所示:
出:
<function _AxesBase.add_patch at 0x7faa00da4158>
关键词:matplotlib代码示例,codex,python plot,pyplot Gallery generated by Sphinx-Gallery