注解
Click here 下载完整的示例代码
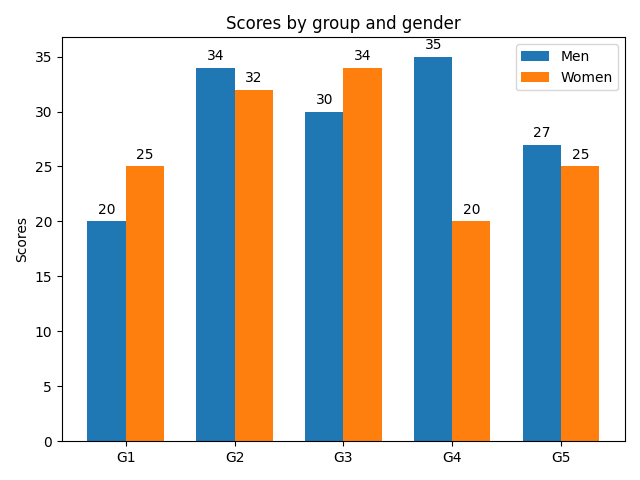
带标签的分组条形图
此示例演示如何创建分组条形图以及如何使用标签对条形图进行批注。
import matplotlib
import matplotlib.pyplot as plt
import numpy as np


labels = ['G1', 'G2', 'G3', 'G4', 'G5']
men_means = [20, 34, 30, 35, 27]
women_means = [25, 32, 34, 20, 25]

x = np.arange(len(labels))  # the label locations
width = 0.35  # the width of the bars

fig, ax = plt.subplots()
rects1 = ax.bar(x - width/2, men_means, width, label='Men')
rects2 = ax.bar(x + width/2, women_means, width, label='Women')

# Add some text for labels, title and custom x-axis tick labels, etc.
ax.set_ylabel('Scores')
ax.set_title('Scores by group and gender')
ax.set_xticks(x)
ax.set_xticklabels(labels)
ax.legend()


def autolabel(rects):
    """Attach a text label above each bar in *rects*, displaying its height."""
    for rect in rects:
        height = rect.get_height()
        ax.annotate('{}'.format(height),
                    xy=(rect.get_x() + rect.get_width() / 2, height),
                    xytext=(0, 3),  # 3 points vertical offset
                    textcoords="offset points",
                    ha='center', va='bottom')


autolabel(rects1)
autolabel(rects2)

fig.tight_layout()

plt.show()
工具书类
本例中显示了以下函数、方法和类的使用:
出:
<function annotate at 0x7faa00cf8a60>
关键词:matplotlib代码示例,codex,python plot,pyplot Gallery generated by Sphinx-Gallery