注解
Click here 下载完整的示例代码
地理预测
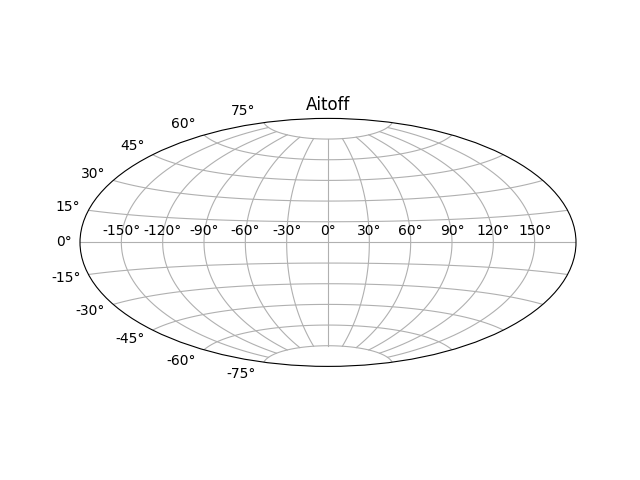
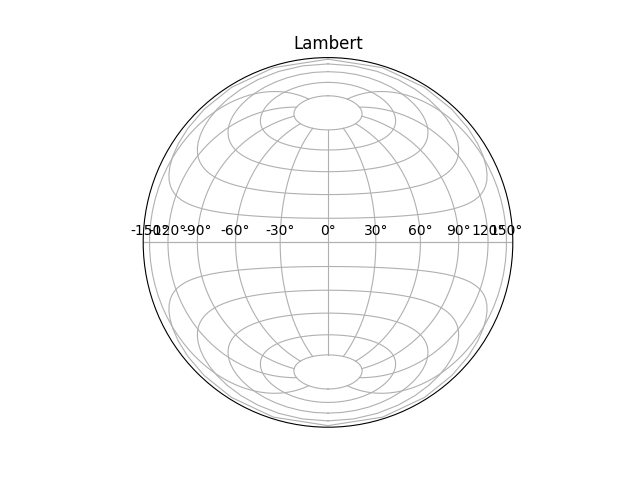
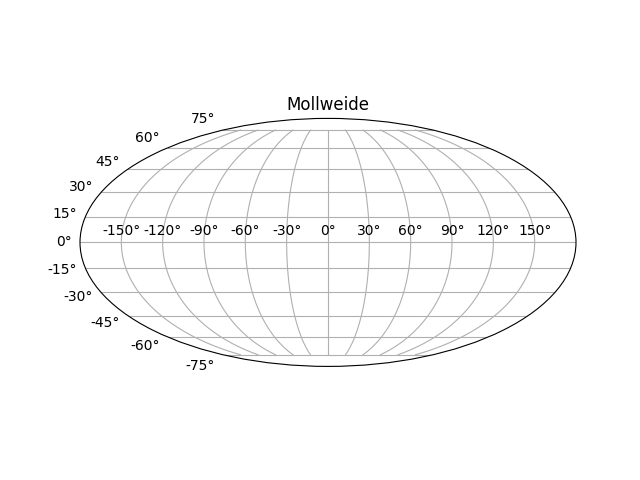
这显示了4种可能的地理预测。 Cartopy 支持更多投影。
import matplotlib.pyplot as plt
plt.figure()
plt.subplot(111, projection="aitoff")
plt.title("Aitoff")
plt.grid(True)
plt.figure()
plt.subplot(111, projection="hammer")
plt.title("Hammer")
plt.grid(True)

plt.figure()
plt.subplot(111, projection="lambert")
plt.title("Lambert")
plt.grid(True)
plt.figure()
plt.subplot(111, projection="mollweide")
plt.title("Mollweide")
plt.grid(True)

plt.show()
脚本的总运行时间: (0分1.446秒)
关键词:matplotlib代码示例,codex,python plot,pyplot Gallery generated by Sphinx-Gallery