matplotlib.pyplot.subplot2grid
-
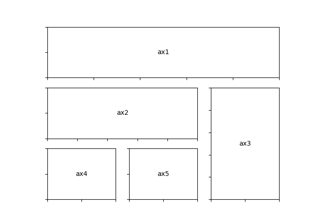
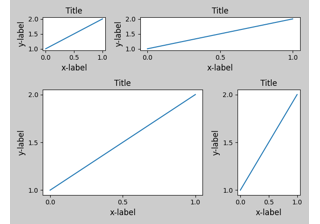
matplotlib.pyplot.subplot2grid(shape, loc, rowspan=1, colspan=1, fig=None, **kwargs)[源代码]¶ 在常规网格中的特定位置创建子图。
参数: - shape(内景,内景)
要放置轴的网格的行数和列数。
- loc(内景,内景)
轴在网格中位置的行号和列号。
- rowspanint,默认值:1
轴向右跨的行数。
- colspanint,默认值:1
轴向下跨距的列数。
- fig :
Figure可选图,可选 放置子地块的图示。默认为当前图形。
- **kwargs
其他关键字参数被传递到
add_subplot.
返回: axes.SubplotBase, or another subclass ofAxes子地块的轴线。返回的axes基类取决于使用的投影。它是
Axes如果使用直线投影projections.polar.PolarAxes如果使用极轴投影。然后,返回的轴是基类的子批子类。
笔记
以下呼叫:
ax = subplot2grid((nrows, ncols), (row, col), rowspan, colspan)
与以下内容相同:
fig = gcf()
gs = fig.add_gridspec(nrows, ncols)
ax = fig.add_subplot(gs[row:row+rowspan, col:col+colspan])