注解
Click here 下载完整的示例代码
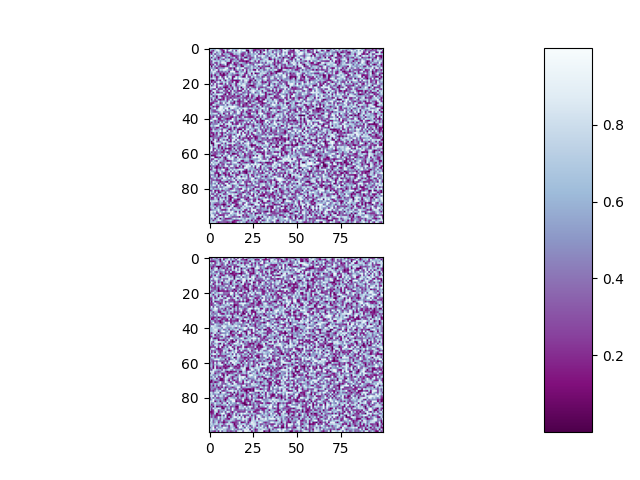
子图调整
使用调整页边距和子图的间距 subplots_adjust .
import matplotlib.pyplot as plt
import numpy as np

# Fixing random state for reproducibility
np.random.seed(19680801)

plt.subplot(211)
plt.imshow(np.random.random((100, 100)), cmap=plt.cm.BuPu_r)
plt.subplot(212)
plt.imshow(np.random.random((100, 100)), cmap=plt.cm.BuPu_r)

plt.subplots_adjust(bottom=0.1, right=0.8, top=0.9)
cax = plt.axes([0.85, 0.1, 0.075, 0.8])
plt.colorbar(cax=cax)
plt.show()
关键词:matplotlib代码示例,codex,python plot,pyplot Gallery generated by Sphinx-Gallery