注解
Click here 下载完整的示例代码
SCOLLO演示
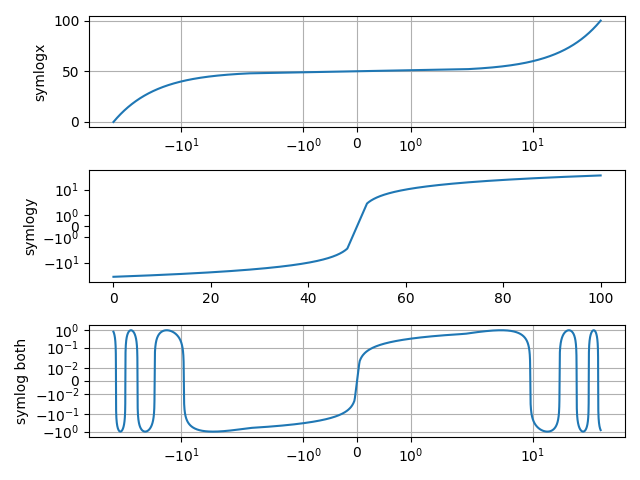
使用symlog(对称日志)轴缩放的示例。
import matplotlib.pyplot as plt
import numpy as np

dt = 0.01
x = np.arange(-50.0, 50.0, dt)
y = np.arange(0, 100.0, dt)

plt.subplot(311)
plt.plot(x, y)
plt.xscale('symlog')
plt.ylabel('symlogx')
plt.grid(True)
plt.gca().xaxis.grid(True, which='minor')  # minor grid on too

plt.subplot(312)
plt.plot(y, x)
plt.yscale('symlog')
plt.ylabel('symlogy')

plt.subplot(313)
plt.plot(x, np.sin(x / 3.0))
plt.xscale('symlog')
plt.yscale('symlog', linthresh=0.015)
plt.grid(True)
plt.ylabel('symlog both')

plt.tight_layout()
plt.show()
关键词:matplotlib代码示例,codex,python plot,pyplot Gallery generated by Sphinx-Gallery