matplotlib.axes
matplotlib.axes.Axes.set_yticks
Axes.
set_yticks
设置yaxis的刻度位置。
勾选位置列表。
如果 False ,设置主刻度;如果 True ,小滴答声。
False
True
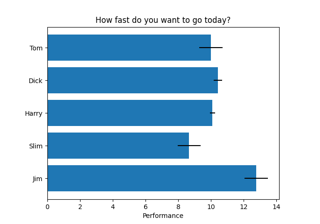
水平条形图
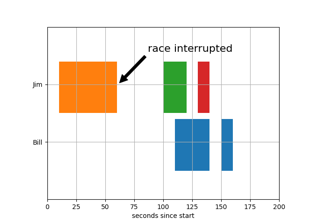
Broken Barh
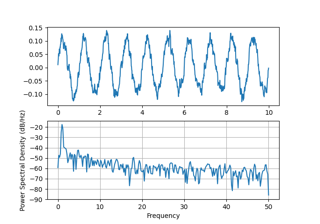
PSD演示
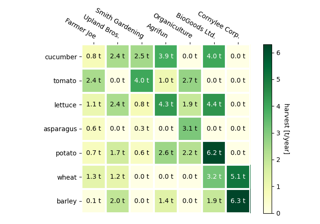
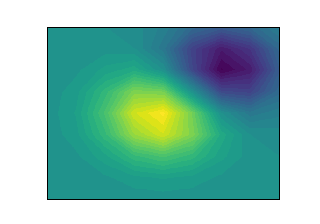
创建带注释的热图
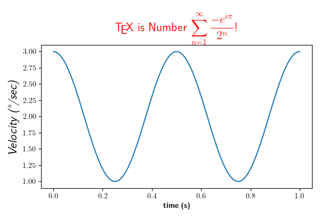
用TeX绘制数学方程
自动子批次调整
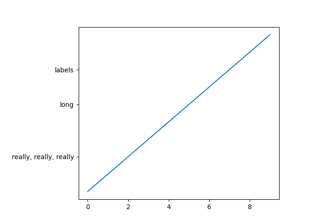
使用axesgrid为ylabel腾出空间
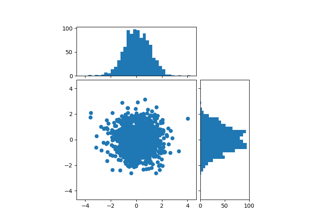
散点直方图(可定位轴)
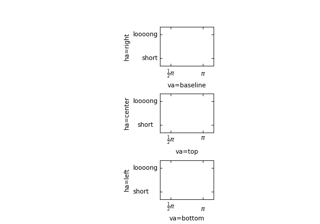
演示TickLabel对齐
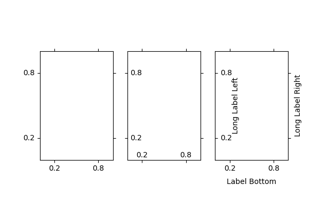
演示TickLabel方向
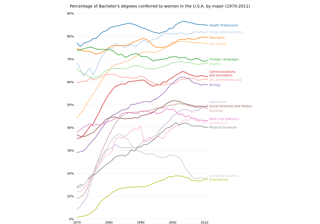
按性别划分的学士学位
火狐
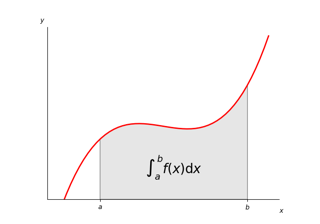
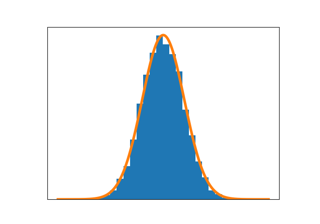
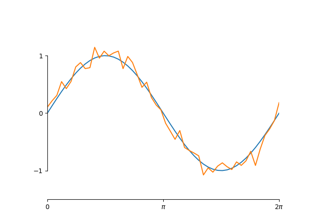
积分为曲线下的面积
阴影和功率标准化渲染
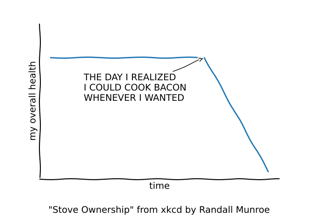
XKCD
模拟降雨
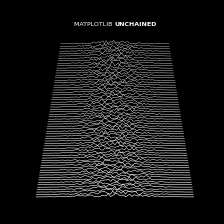
MATPLOTLIB UNCHAINED
FrontPage 3D示例
FrontPage轮廓示例
FrontPage柱状图示例
FrontPage绘图示例
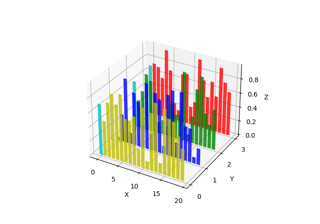
在不同平面中创建二维条形图
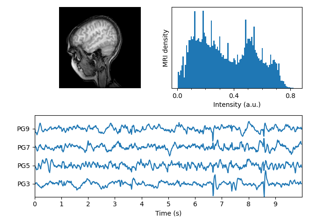
磁共振脑电图
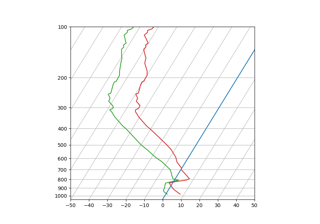
歪斜logp图:使用转换和自定义投影
自定义脊椎边界