注解
Click here 下载完整的示例代码
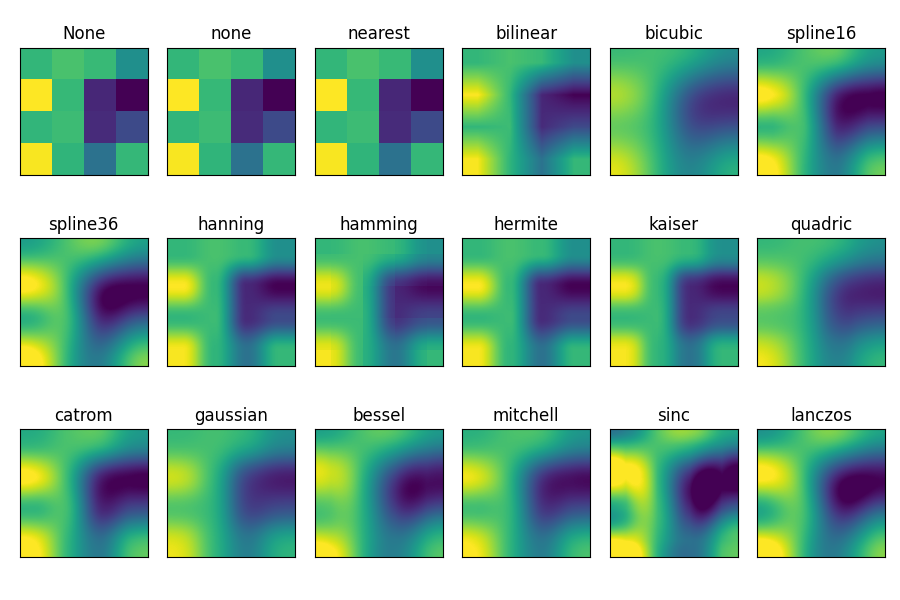
imshow插值
此示例显示了插值方法之间的差异 imshow .
如果 插值 是“无”,它默认为 rcParams["image.interpolation"] (default: 'antialiased') . 如果插值是 'none' ,则不会对agg、ps和pdf后端执行插值。其他后端将默认为 'antialiased' .
对于agg、ps和pdf后端, interpolation = 'none' 当一个大的图像被缩小时工作良好,而 interpolation = 'nearest' 当放大一个小图像时效果很好。
见 图像抗锯齿 关于违约的讨论 interpolation="antialiased" 选择权。
import matplotlib.pyplot as plt
import numpy as np

methods = [None, 'none', 'nearest', 'bilinear', 'bicubic', 'spline16',
           'spline36', 'hanning', 'hamming', 'hermite', 'kaiser', 'quadric',
           'catrom', 'gaussian', 'bessel', 'mitchell', 'sinc', 'lanczos']

# Fixing random state for reproducibility
np.random.seed(19680801)

grid = np.random.rand(4, 4)

fig, axs = plt.subplots(nrows=3, ncols=6, figsize=(9, 6),
                        subplot_kw={'xticks': [], 'yticks': []})

for ax, interp_method in zip(axs.flat, methods):
    ax.imshow(grid, interpolation=interp_method, cmap='viridis')
    ax.set_title(str(interp_method))

plt.tight_layout()
plt.show()
工具书类
本例中显示了以下函数和方法的使用:
import matplotlib
matplotlib.axes.Axes.imshow
matplotlib.pyplot.imshow
出:
<function imshow at 0x7faa00cfa9d8>
脚本的总运行时间: (0分1.663秒)
关键词:matplotlib代码示例,codex,python plot,pyplot Gallery generated by Sphinx-Gallery