注解
Click here 下载完整的示例代码
图像抗锯齿
图像由离散像素表示,无论是在屏幕上还是在图像文件中。当组成图像的数据的分辨率与其在屏幕上的表示不同时,我们将看到锯齿效果。
Matplotlib中的默认图像插值是“抗锯齿”。这在大多数情况下使用汉宁插值来减少混叠。只有当上采样因子为1、2或>=3时,才使用“最近”相邻插值。
可以在中指定其他抗锯齿过滤器 Axes.imshow 使用 插值 关键字参数。
import numpy as np
import matplotlib.pyplot as plt
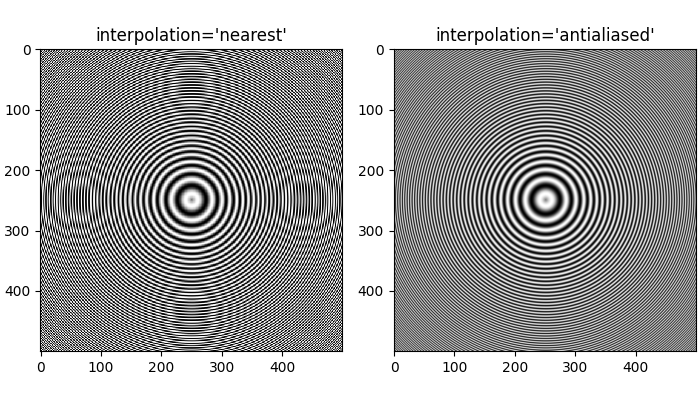
首先,我们生成一个500x500像素的图像,其中包含不同的频率内容:
以下图像是从500个数据像素到303个渲染像素的二次采样。“最近”插值中的云纹图案是由于对高频数据进行二次采样而产生的。“抗锯齿”图像仍然有一些云纹图案,但它们大大减少了。
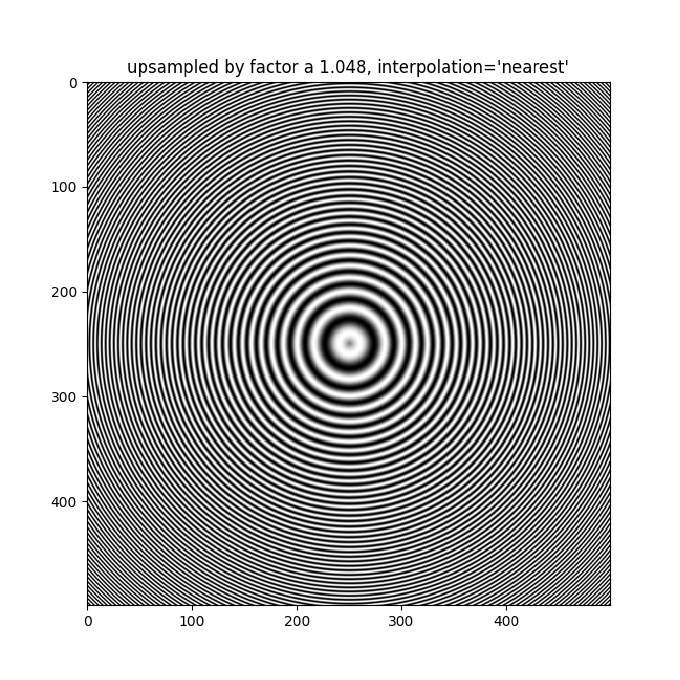
当上采样因子不是整数时,即使使用“最近”插值对图像进行上采样也会导致云纹图案。下面的图像将500个数据像素上采样到530个渲染像素。你可能会注意到一个由30个线状伪影组成的网格,这些伪影源于524-500=24个额外像素,而这些额外像素是必须组成的。因此,它们看起来和相邻的像素线的插值是一样的。
fig, ax = plt.subplots(figsize=(6.8, 6.8))
ax.imshow(a, interpolation='nearest', cmap='gray')
ax.set_title("upsampled by factor a 1.048, interpolation='nearest'")
plt.show()
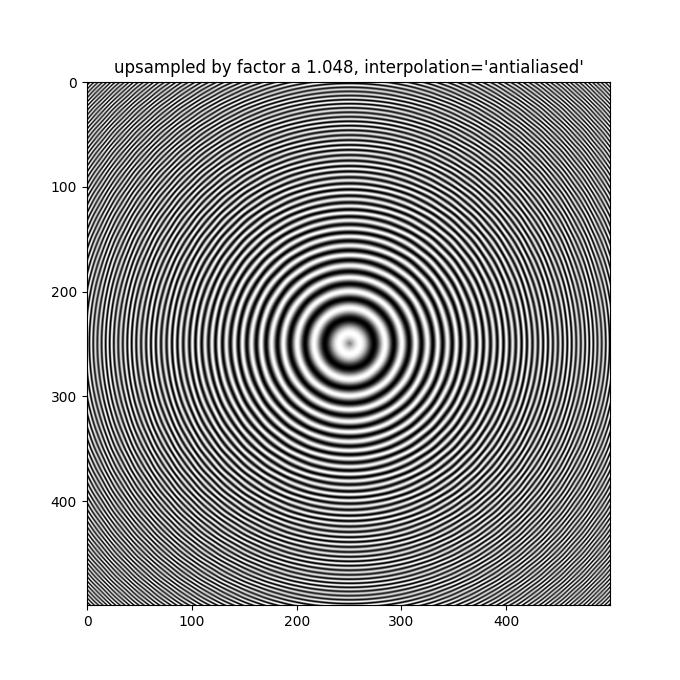
更好的抗锯齿算法可以减少这种影响:
fig, ax = plt.subplots(figsize=(6.8, 6.8))
ax.imshow(a, interpolation='antialiased', cmap='gray')
ax.set_title("upsampled by factor a 1.048, interpolation='antialiased'")
plt.show()
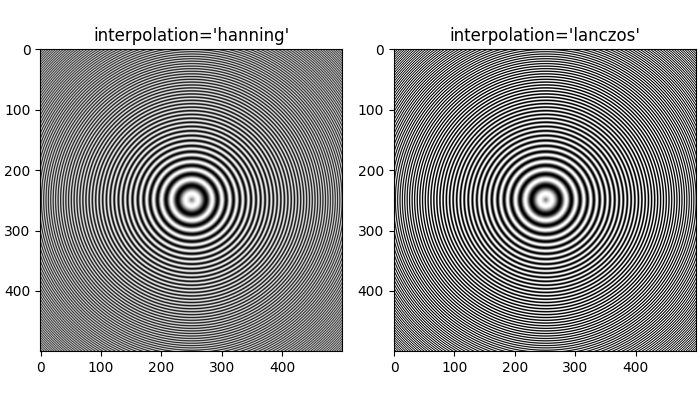
除了默认的“汉宁”抗锯齿 imshow 根据不同的模式,不同的插值算法或更好的算法。
工具书类
本例中显示了以下函数和方法的使用:
import matplotlib
matplotlib.axes.Axes.imshow
出:
<function Axes.imshow at 0x7faa00dc7488>
脚本的总运行时间: (0分2.071秒)
关键词:matplotlib代码示例,codex,python plot,pyplot Gallery generated by Sphinx-Gallery