注解
Click here 下载完整的示例代码
拾取事件演示
您可以通过设置艺术家的“Picker”属性来启用拾取(例如,matplotlib line2d、text、patch、polygon、axesImage等)
picker属性有多种含义:
None -已为此艺术家禁用拾取(默认)
布尔-如果 True 然后将启用拾取,并且如果鼠标事件位于艺术家上方,艺术家将触发拾取事件。
设置
pickradius将在点中添加epsilon容差,并且如果事件的数据在鼠标事件的epsilon范围内,则艺术家将触发事件。对于线和面片集合之类的一些美工人员,美工人员可以向生成的pick事件提供附加数据,例如,pick事件epsilon内的数据索引函数-如果picker是可调用的,则它是用户提供的函数,用于确定艺术家是否被鼠标事件击中。
点击,道具=选取器(艺术家,鼠标事件)
以确定命中测试。如果鼠标事件位于艺术家上方,则返回hit=True,并且props是要添加到PickEvent属性的属性字典。
通过设置“Picker”属性启用艺术家拾取后,需要连接到“Figure Canvas Pick_”事件以获取鼠标按下事件的拾取回调。例如,
- def pick_处理程序(事件):
- mouseEvent=event.mouseEvent artist=event.artist现在就做点什么……
传递给回调的pick事件(matplotlib.backend_base.pick event)始终使用两个属性激发:
- mouseEvent-生成pick事件的鼠标事件。这个
- 鼠标事件依次具有x和y(显示空间中的坐标,例如从左到下的像素)和x data、y data(数据空间中的坐标)等属性。此外,您还可以获取有关按下了哪些按钮、按下了哪些键、鼠标位于哪个轴上等的信息。有关详细信息,请参阅matplotlib.backend_base.mouseEvent。
artist-生成pick事件的matplotlib.artist。
此外,某些艺术家(如Line2d和PatchCollection)可以将其他元数据(如索引)附加到符合选取器标准的数据中(例如,行中所有在指定epsilon公差范围内的点)。
下面的例子说明了这些方法中的每一种。
import matplotlib.pyplot as plt
from matplotlib.lines import Line2D
from matplotlib.patches import Rectangle
from matplotlib.text import Text
from matplotlib.image import AxesImage
import numpy as np
from numpy.random import rand
# Fixing random state for reproducibility
np.random.seed(19680801)
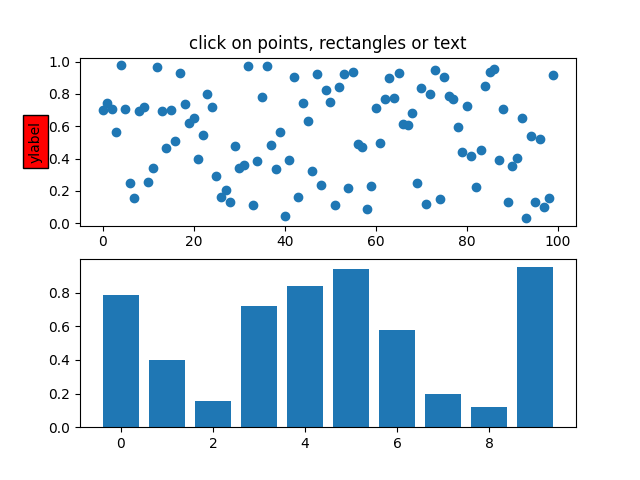
def pick_simple():
# simple picking, lines, rectangles and text
fig, (ax1, ax2) = plt.subplots(2, 1)
ax1.set_title('click on points, rectangles or text', picker=True)
ax1.set_ylabel('ylabel', picker=True, bbox=dict(facecolor='red'))
line, = ax1.plot(rand(100), 'o', picker=True, pickradius=5)
# pick the rectangle
ax2.bar(range(10), rand(10), picker=True)
for label in ax2.get_xticklabels(): # make the xtick labels pickable
label.set_picker(True)
def onpick1(event):
if isinstance(event.artist, Line2D):
thisline = event.artist
xdata = thisline.get_xdata()
ydata = thisline.get_ydata()
ind = event.ind
print('onpick1 line:', np.column_stack([xdata[ind], ydata[ind]]))
elif isinstance(event.artist, Rectangle):
patch = event.artist
print('onpick1 patch:', patch.get_path())
elif isinstance(event.artist, Text):
text = event.artist
print('onpick1 text:', text.get_text())
fig.canvas.mpl_connect('pick_event', onpick1)
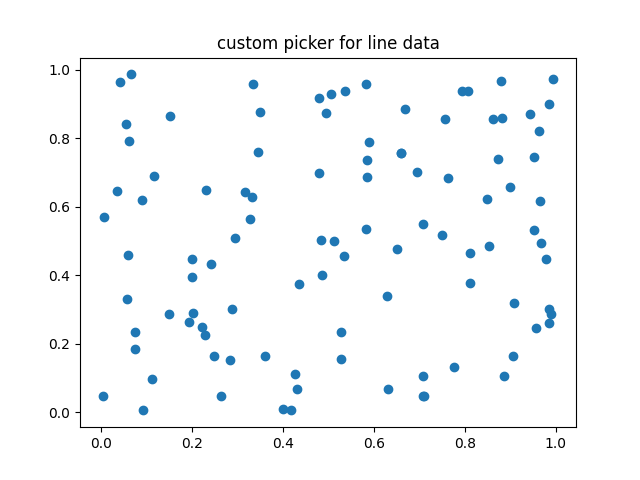
def pick_custom_hit():
# picking with a custom hit test function
# you can define custom pickers by setting picker to a callable
# function. The function has the signature
#
# hit, props = func(artist, mouseevent)
#
# to determine the hit test. if the mouse event is over the artist,
# return hit=True and props is a dictionary of
# properties you want added to the PickEvent attributes
def line_picker(line, mouseevent):
"""
Find the points within a certain distance from the mouseclick in
data coords and attach some extra attributes, pickx and picky
which are the data points that were picked.
"""
if mouseevent.xdata is None:
return False, dict()
xdata = line.get_xdata()
ydata = line.get_ydata()
maxd = 0.05
d = np.sqrt(
(xdata - mouseevent.xdata)**2 + (ydata - mouseevent.ydata)**2)
ind, = np.nonzero(d <= maxd)
if len(ind):
pickx = xdata[ind]
picky = ydata[ind]
props = dict(ind=ind, pickx=pickx, picky=picky)
return True, props
else:
return False, dict()
def onpick2(event):
print('onpick2 line:', event.pickx, event.picky)
fig, ax = plt.subplots()
ax.set_title('custom picker for line data')
line, = ax.plot(rand(100), rand(100), 'o', picker=line_picker)
fig.canvas.mpl_connect('pick_event', onpick2)
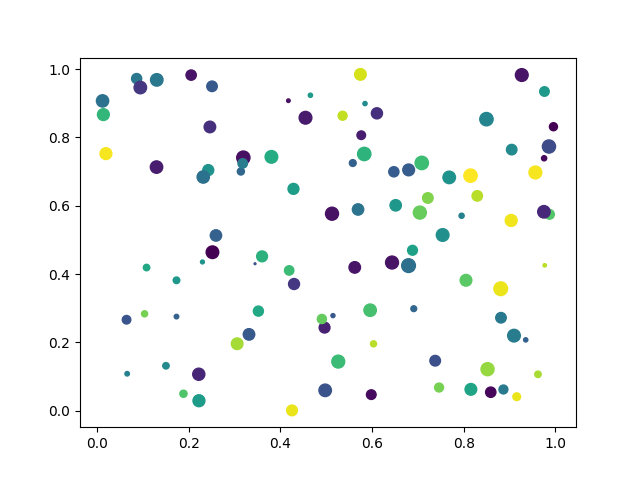
def pick_scatter_plot():
# picking on a scatter plot (matplotlib.collections.RegularPolyCollection)
x, y, c, s = rand(4, 100)
def onpick3(event):
ind = event.ind
print('onpick3 scatter:', ind, x[ind], y[ind])
fig, ax = plt.subplots()
ax.scatter(x, y, 100*s, c, picker=True)
fig.canvas.mpl_connect('pick_event', onpick3)
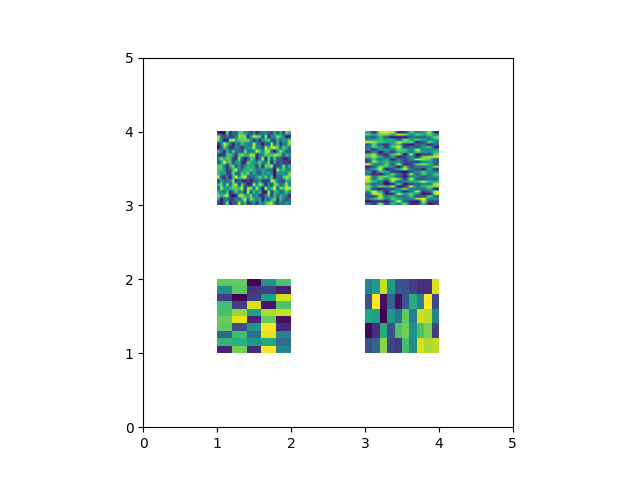
def pick_image():
# picking images (matplotlib.image.AxesImage)
fig, ax = plt.subplots()
ax.imshow(rand(10, 5), extent=(1, 2, 1, 2), picker=True)
ax.imshow(rand(5, 10), extent=(3, 4, 1, 2), picker=True)
ax.imshow(rand(20, 25), extent=(1, 2, 3, 4), picker=True)
ax.imshow(rand(30, 12), extent=(3, 4, 3, 4), picker=True)
ax.set(xlim=(0, 5), ylim=(0, 5))
def onpick4(event):
artist = event.artist
if isinstance(artist, AxesImage):
im = artist
A = im.get_array()
print('onpick4 image', A.shape)
fig.canvas.mpl_connect('pick_event', onpick4)
if __name__ == '__main__':
pick_simple()
pick_custom_hit()
pick_scatter_plot()
pick_image()
plt.show()
脚本的总运行时间: (0分1.483秒)
关键词:matplotlib代码示例,codex,python plot,pyplot Gallery generated by Sphinx-Gallery