注解
Click here 下载完整的示例代码
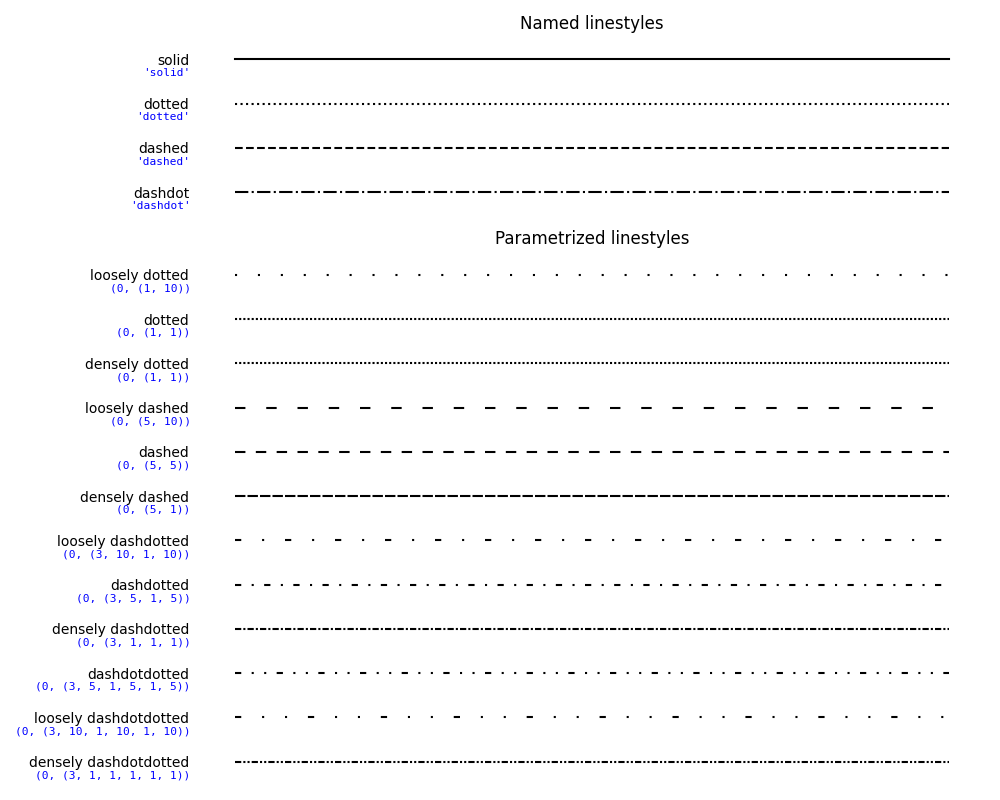
直线运动
可以使用字符串“solid”、“dotted”、“dashdot”或“dashdot”来定义简单的线型。通过提供破折号元组可以实现更精细的控制 (offset, (on_off_seq)) . 例如, (0, (3, 10, 1, 15)) 表示(3磅线,10磅间距,1磅线,15磅间距),无偏移。另请参见 Line2D.set_linestyle .
Note :短划线样式也可以通过 Line2D.set_dashes 如所示 自定义虚线样式 并使用关键字传递短划线序列的列表 破折号 去骑自行车 property_cycle .
import numpy as np
import matplotlib.pyplot as plt

linestyle_str = [
     ('solid', 'solid'),      # Same as (0, ()) or '-'
     ('dotted', 'dotted'),    # Same as (0, (1, 1)) or '.'
     ('dashed', 'dashed'),    # Same as '--'
     ('dashdot', 'dashdot')]  # Same as '-.'

linestyle_tuple = [
     ('loosely dotted',        (0, (1, 10))),
     ('dotted',                (0, (1, 1))),
     ('densely dotted',        (0, (1, 1))),

     ('loosely dashed',        (0, (5, 10))),
     ('dashed',                (0, (5, 5))),
     ('densely dashed',        (0, (5, 1))),

     ('loosely dashdotted',    (0, (3, 10, 1, 10))),
     ('dashdotted',            (0, (3, 5, 1, 5))),
     ('densely dashdotted',    (0, (3, 1, 1, 1))),

     ('dashdotdotted',         (0, (3, 5, 1, 5, 1, 5))),
     ('loosely dashdotdotted', (0, (3, 10, 1, 10, 1, 10))),
     ('densely dashdotdotted', (0, (3, 1, 1, 1, 1, 1)))]


def plot_linestyles(ax, linestyles, title):
    X, Y = np.linspace(0, 100, 10), np.zeros(10)
    yticklabels = []

    for i, (name, linestyle) in enumerate(linestyles):
        ax.plot(X, Y+i, linestyle=linestyle, linewidth=1.5, color='black')
        yticklabels.append(name)

    ax.set_title(title)
    ax.set(ylim=(-0.5, len(linestyles)-0.5),
           yticks=np.arange(len(linestyles)),
           yticklabels=yticklabels)
    ax.tick_params(left=False, bottom=False, labelbottom=False)
    for spine in ax.spines.values():
        spine.set_visible(False)

    # For each line style, add a text annotation with a small offset from
    # the reference point (0 in Axes coords, y tick value in Data coords).
    for i, (name, linestyle) in enumerate(linestyles):
        ax.annotate(repr(linestyle),
                    xy=(0.0, i), xycoords=ax.get_yaxis_transform(),
                    xytext=(-6, -12), textcoords='offset points',
                    color="blue", fontsize=8, ha="right", family="monospace")


ax0, ax1 = (plt.figure(figsize=(10, 8))
            .add_gridspec(2, 1, height_ratios=[1, 3])
            .subplots())

plot_linestyles(ax0, linestyle_str[::-1], title='Named linestyles')
plot_linestyles(ax1, linestyle_tuple[::-1], title='Parametrized linestyles')

plt.tight_layout()
plt.show()
关键词:matplotlib代码示例,codex,python plot,pyplot Gallery generated by Sphinx-Gallery