注解
Click here 下载完整的示例代码
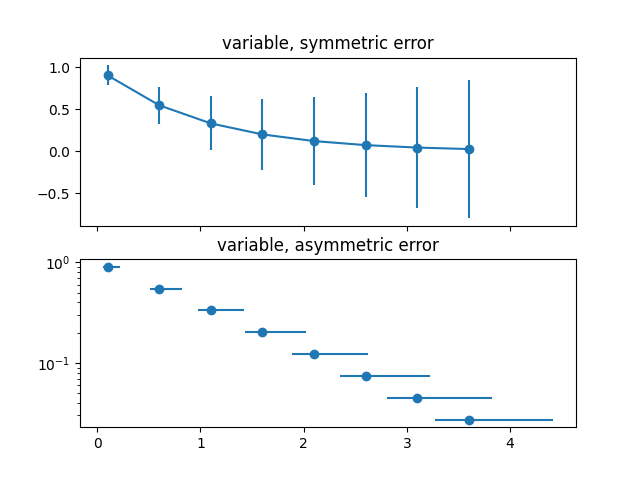
指定误差线的不同方法
错误可以指定为常量值(如 误差条函数 )然而,这个例子通过指定错误值数组来演示它们是如何变化的。
如果生 x 和 y 数据有长度n,有两个选项:
- 形状数组(n,):
- 每个点的误差各不相同,但误差值是对称的(即上下值相等)。
- 形状数组(2,n):
- 每个点的误差各不相同,下限和上限(按该顺序)也不同(不对称情况)
另外,这个例子演示了如何使用带有误差条的对数刻度。
import numpy as np
import matplotlib.pyplot as plt

# example data
x = np.arange(0.1, 4, 0.5)
y = np.exp(-x)

# example error bar values that vary with x-position
error = 0.1 + 0.2 * x

fig, (ax0, ax1) = plt.subplots(nrows=2, sharex=True)
ax0.errorbar(x, y, yerr=error, fmt='-o')
ax0.set_title('variable, symmetric error')

# error bar values w/ different -/+ errors that
# also vary with the x-position
lower_error = 0.4 * error
upper_error = error
asymmetric_error = [lower_error, upper_error]

ax1.errorbar(x, y, xerr=asymmetric_error, fmt='o')
ax1.set_title('variable, asymmetric error')
ax1.set_yscale('log')
plt.show()
关键词:matplotlib代码示例,codex,python plot,pyplot Gallery generated by Sphinx-Gallery