注解
Click here 下载完整的示例代码
PyPrand数学模型
在文本标签中使用数学表达式。有关MathText的概述,请参见 写数学表达式 .
import numpy as np
import matplotlib.pyplot as plt
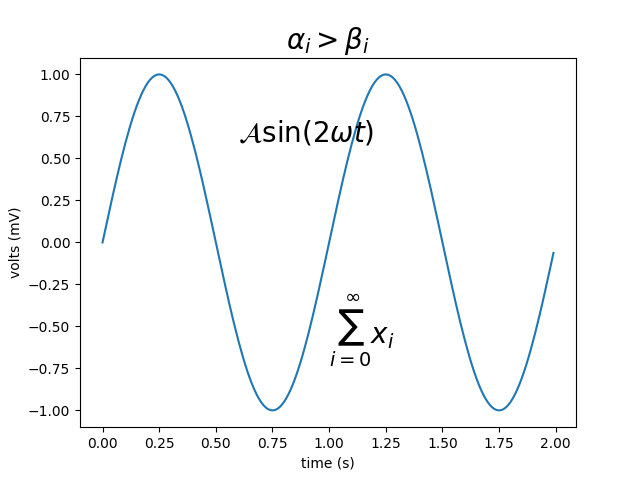
t = np.arange(0.0, 2.0, 0.01)
s = np.sin(2*np.pi*t)
plt.plot(t, s)
plt.title(r'$\alpha_i > \beta_i$', fontsize=20)
plt.text(1, -0.6, r'$\sum_{i=0}^\infty x_i$', fontsize=20)
plt.text(0.6, 0.6, r'$\mathcal{A}\mathrm{sin}(2 \omega t)$',
fontsize=20)
plt.xlabel('time (s)')
plt.ylabel('volts (mV)')
plt.show()
工具书类
以下函数、方法、类和模块的使用如本例所示:
import matplotlib
matplotlib.pyplot.text
matplotlib.axes.Axes.text
出:
<function Axes.text at 0x7faa00db27b8>
关键词:matplotlib代码示例,codex,python plot,pyplot Gallery generated by Sphinx-Gallery