注解
Click here 下载完整的示例代码
人工轮廓
使用轮廓集显示自己的轮廓线和多边形的示例。
import matplotlib.pyplot as plt
from matplotlib.contour import ContourSet
import matplotlib.cm as cm
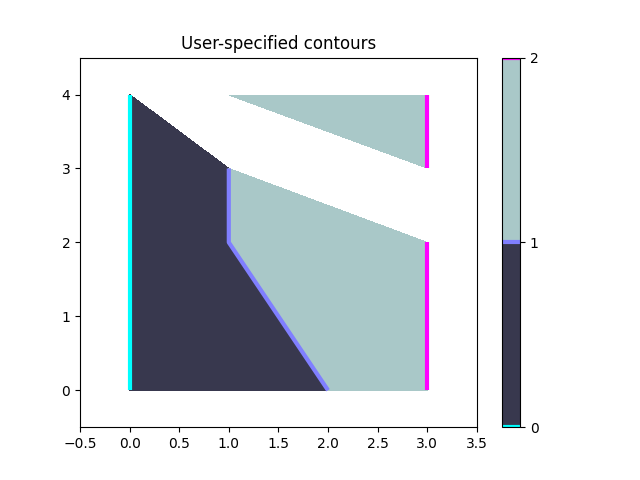
每个级别的轮廓线是多边形的列表/元组。
两个级别之间的填充轮廓也是多边形列表/元组。点可以顺时针或逆时针排列。
fig, ax = plt.subplots()

# Filled contours using filled=True.
cs = ContourSet(ax, [0, 1, 2], [filled01, filled12], filled=True, cmap=cm.bone)
cbar = fig.colorbar(cs)

# Contour lines (non-filled).
lines = ContourSet(
    ax, [0, 1, 2], [lines0, lines1, lines2], cmap=cm.cool, linewidths=3)
cbar.add_lines(lines)

ax.set(xlim=(-0.5, 3.5), ylim=(-0.5, 4.5),
       title='User-specified contours')
出:
[(-0.5, 3.5), (-0.5, 4.5), Text(0.5, 1.0, 'User-specified contours')]
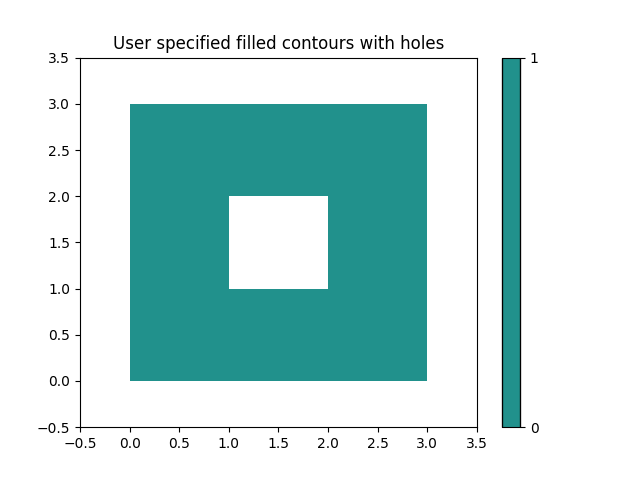
可以在一个多边形顶点列表中指定多条填充轮廓线,以及路径类中描述的顶点类型(代码类型)列表。这对于有洞的多边形特别有用。这里代码类型1是moveto,2是lineto。
fig, ax = plt.subplots()
filled01 = [[[0, 0], [3, 0], [3, 3], [0, 3], [1, 1], [1, 2], [2, 2], [2, 1]]]
kinds01 = [[1, 2, 2, 2, 1, 2, 2, 2]]
cs = ContourSet(ax, [0, 1], [filled01], [kinds01], filled=True)
cbar = fig.colorbar(cs)

ax.set(xlim=(-0.5, 3.5), ylim=(-0.5, 3.5),
       title='User specified filled contours with holes')

plt.show()
关键词:matplotlib代码示例,codex,python plot,pyplot Gallery generated by Sphinx-Gallery