注解
Click here 下载完整的示例代码
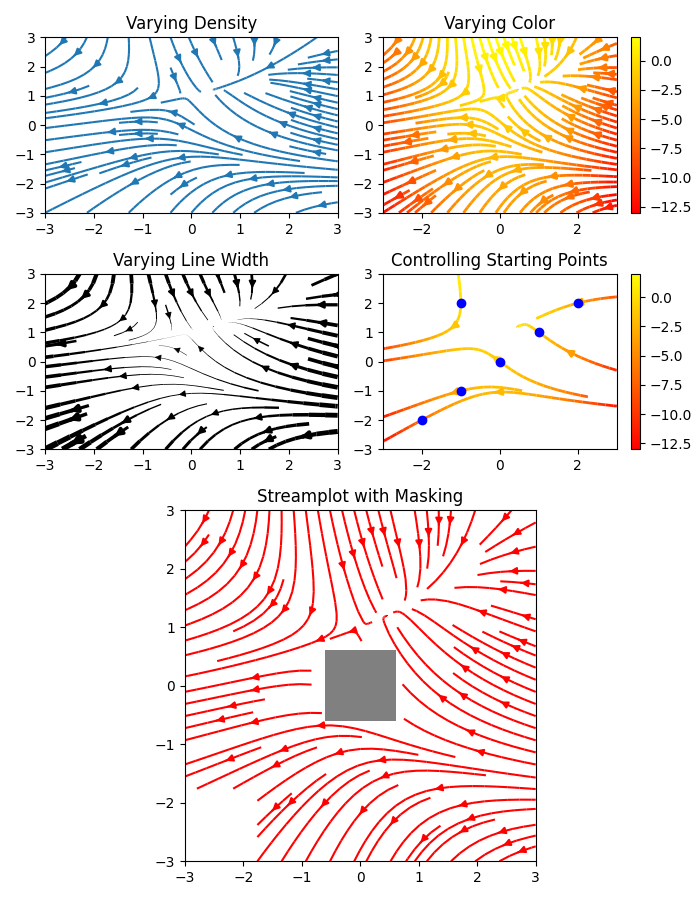
流线图
流图或流线图用于显示二维矢量场。这个例子显示了 streamplot 功能:
- 沿着流线改变颜色。
- 改变流线的密度。
- 沿流线改变线条宽度。
- 控制流线的起点。
- 流线跳过遮罩区域和NaN值。
import numpy as np
import matplotlib.pyplot as plt
import matplotlib.gridspec as gridspec

w = 3
Y, X = np.mgrid[-w:w:100j, -w:w:100j]
U = -1 - X**2 + Y
V = 1 + X - Y**2
speed = np.sqrt(U**2 + V**2)

fig = plt.figure(figsize=(7, 9))
gs = gridspec.GridSpec(nrows=3, ncols=2, height_ratios=[1, 1, 2])

#  Varying density along a streamline
ax0 = fig.add_subplot(gs[0, 0])
ax0.streamplot(X, Y, U, V, density=[0.5, 1])
ax0.set_title('Varying Density')

# Varying color along a streamline
ax1 = fig.add_subplot(gs[0, 1])
strm = ax1.streamplot(X, Y, U, V, color=U, linewidth=2, cmap='autumn')
fig.colorbar(strm.lines)
ax1.set_title('Varying Color')

#  Varying line width along a streamline
ax2 = fig.add_subplot(gs[1, 0])
lw = 5*speed / speed.max()
ax2.streamplot(X, Y, U, V, density=0.6, color='k', linewidth=lw)
ax2.set_title('Varying Line Width')

# Controlling the starting points of the streamlines
seed_points = np.array([[-2, -1, 0, 1, 2, -1], [-2, -1,  0, 1, 2, 2]])

ax3 = fig.add_subplot(gs[1, 1])
strm = ax3.streamplot(X, Y, U, V, color=U, linewidth=2,
                      cmap='autumn', start_points=seed_points.T)
fig.colorbar(strm.lines)
ax3.set_title('Controlling Starting Points')

# Displaying the starting points with blue symbols.
ax3.plot(seed_points[0], seed_points[1], 'bo')
ax3.set(xlim=(-w, w), ylim=(-w, w))

# Create a mask
mask = np.zeros(U.shape, dtype=bool)
mask[40:60, 40:60] = True
U[:20, :20] = np.nan
U = np.ma.array(U, mask=mask)

ax4 = fig.add_subplot(gs[2:, :])
ax4.streamplot(X, Y, U, V, color='r')
ax4.set_title('Streamplot with Masking')

ax4.imshow(~mask, extent=(-w, w, -w, w), alpha=0.5, cmap='gray', aspect='auto')
ax4.set_aspect('equal')

plt.tight_layout()
plt.show()
工具书类
本例中显示了以下函数和方法的使用:
脚本的总运行时间: (0分3.173秒)
关键词:matplotlib代码示例,codex,python plot,pyplot Gallery generated by Sphinx-Gallery