注解
Click here 下载完整的示例代码
自定义TICK1
新的Ticker代码旨在明确支持用户自定义的Ticking。文件 matplotlib.ticker 详细说明此过程。该代码定义了许多预设的断续器,但主要是为用户可扩展而设计的。
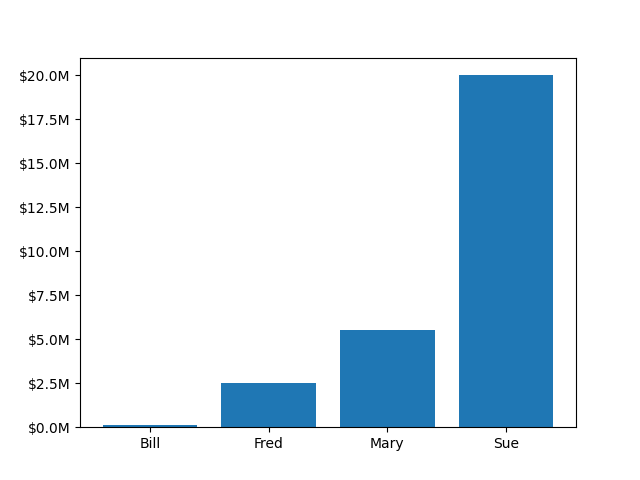
在本例中,用户定义的函数用于格式化Y轴上数百万美元的刻度。
import matplotlib.pyplot as plt

money = [1.5e5, 2.5e6, 5.5e6, 2.0e7]


def millions(x, pos):
    """The two args are the value and tick position."""
    return '${:1.1f}M'.format(x*1e-6)

fig, ax = plt.subplots()
# Use automatic FuncFormatter creation
ax.yaxis.set_major_formatter(millions)
ax.bar(['Bill', 'Fred', 'Mary', 'Sue'], money)
plt.show()
工具书类
以下函数、方法、类和模块的使用如本例所示:
关键词:matplotlib代码示例,codex,python plot,pyplot Gallery generated by Sphinx-Gallery