注解
Click here 下载完整的示例代码
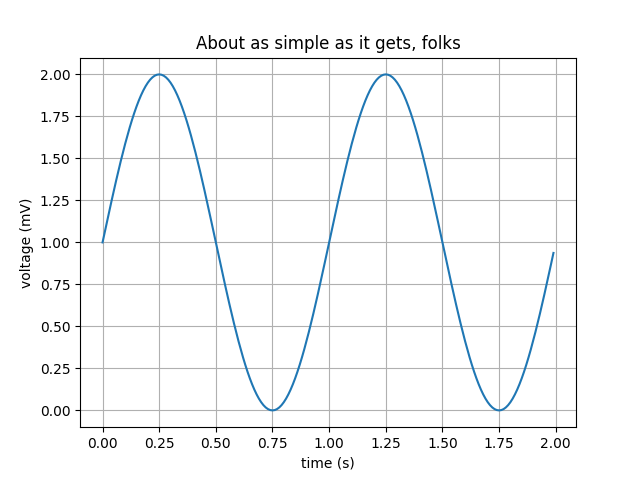
简单情节
创建一个简单的绘图。
import matplotlib
import matplotlib.pyplot as plt
import numpy as np

# Data for plotting
t = np.arange(0.0, 2.0, 0.01)
s = 1 + np.sin(2 * np.pi * t)

fig, ax = plt.subplots()
ax.plot(t, s)

ax.set(xlabel='time (s)', ylabel='voltage (mV)',
       title='About as simple as it gets, folks')
ax.grid()

fig.savefig("test.png")
plt.show()
工具书类
本例中显示了以下函数和方法的使用:
出:
<function Figure.savefig at 0x7faa00ce5378>
关键词:matplotlib代码示例,codex,python plot,pyplot Gallery generated by Sphinx-Gallery