注解
Click here 下载完整的示例代码
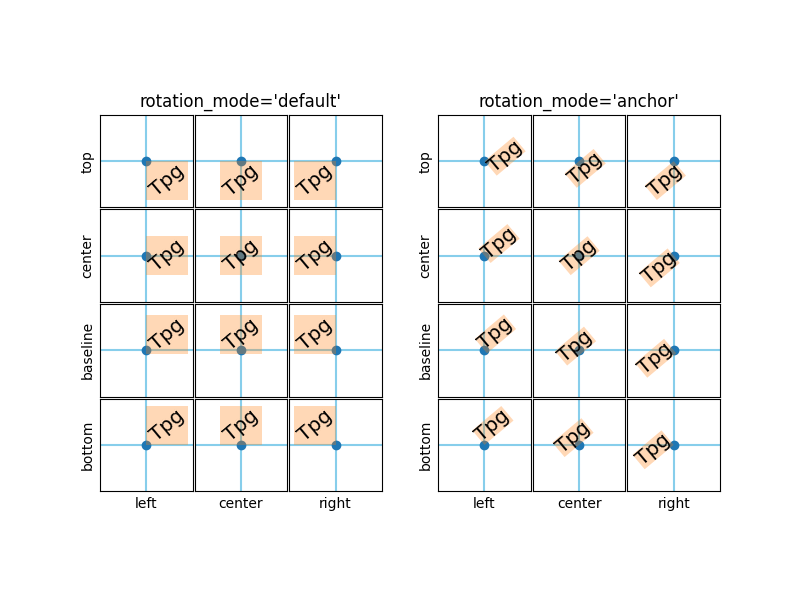
演示文本旋转模式
这个例子说明了这个效果 rotation_mode 关于旋转文本的定位问题。
旋转的 Text 通过传递参数创建 rotation 到构造函数或轴的方法 text .
实际定位取决于附加参数 horizontalalignment , verticalalignment 和 rotation_mode . rotation_mode 确定旋转和对齐的顺序:
rotation_mode='default'(或无)首先旋转文本,然后对齐旋转文本的边框。rotation_mode='anchor'对齐未旋转的文本,然后围绕对齐点旋转文本。
import matplotlib.pyplot as plt
from mpl_toolkits.axes_grid1.axes_grid import ImageGrid


def test_rotation_mode(fig, mode, subplot_location):
    ha_list = ["left", "center", "right"]
    va_list = ["top", "center", "baseline", "bottom"]
    grid = ImageGrid(fig, subplot_location,
                     nrows_ncols=(len(va_list), len(ha_list)),
                     share_all=True, aspect=True, cbar_mode=None)

    # labels and title
    for ha, ax in zip(ha_list, grid.axes_row[-1]):
        ax.axis["bottom"].label.set_text(ha)
    for va, ax in zip(va_list, grid.axes_column[0]):
        ax.axis["left"].label.set_text(va)
    grid.axes_row[0][1].set_title(f"rotation_mode='{mode}'", size="large")

    if mode == "default":
        kw = dict()
    else:
        kw = dict(
            bbox=dict(boxstyle="square,pad=0.", ec="none", fc="C1", alpha=0.3))

    # use a different text alignment in each axes
    texts = []
    for (va, ha), ax in zip([(x, y) for x in va_list for y in ha_list], grid):
        # prepare axes layout
        for axis in ax.axis.values():
            axis.toggle(ticks=False, ticklabels=False)
        ax.axvline(0.5, color="skyblue", zorder=0)
        ax.axhline(0.5, color="skyblue", zorder=0)
        ax.plot(0.5, 0.5, color="C0", marker="o", zorder=1)

        # add text with rotation and alignment settings
        tx = ax.text(0.5, 0.5, "Tpg",
                     size="x-large", rotation=40,
                     horizontalalignment=ha, verticalalignment=va,
                     rotation_mode=mode, **kw)
        texts.append(tx)

    if mode == "default":
        # highlight bbox
        fig.canvas.draw()
        for ax, tx in zip(grid, texts):
            bb = tx.get_window_extent().transformed(ax.transData.inverted())
            rect = plt.Rectangle((bb.x0, bb.y0), bb.width, bb.height,
                                 facecolor="C1", alpha=0.3, zorder=2)
            ax.add_patch(rect)


fig = plt.figure(figsize=(8, 6))
test_rotation_mode(fig, "default", 121)
test_rotation_mode(fig, "anchor", 122)
plt.show()
工具书类
此示例中显示了以下方法的使用:
import matplotlib
matplotlib.axes.Axes.text
出:
<function Axes.text at 0x7faa00db27b8>
脚本的总运行时间: (0分2.104秒)
关键词:matplotlib代码示例,codex,python plot,pyplot Gallery generated by Sphinx-Gallery