注解
Click here 下载完整的示例代码
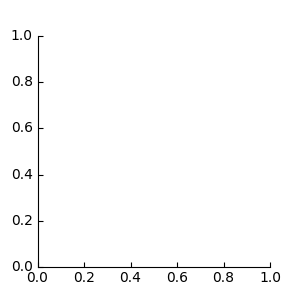
简单轴线3

import matplotlib.pyplot as plt
from mpl_toolkits.axisartist.axislines import Subplot

fig = plt.figure(figsize=(3, 3))

ax = Subplot(fig, 111)
fig.add_subplot(ax)

ax.axis["right"].set_visible(False)
ax.axis["top"].set_visible(False)

plt.show()
关键词:matplotlib代码示例,codex,python plot,pyplot Gallery generated by Sphinx-Gallery