注解
Click here 下载完整的示例代码
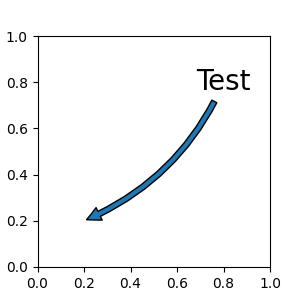
注释simple02
import matplotlib.pyplot as plt


fig, ax = plt.subplots(figsize=(3, 3))

ax.annotate("Test",
            xy=(0.2, 0.2), xycoords='data',
            xytext=(0.8, 0.8), textcoords='data',
            size=20, va="center", ha="center",
            arrowprops=dict(arrowstyle="simple",
                            connectionstyle="arc3,rad=-0.2"),
            )

plt.show()
关键词:matplotlib代码示例,codex,python plot,pyplot Gallery generated by Sphinx-Gallery