注解
Click here 下载完整的示例代码
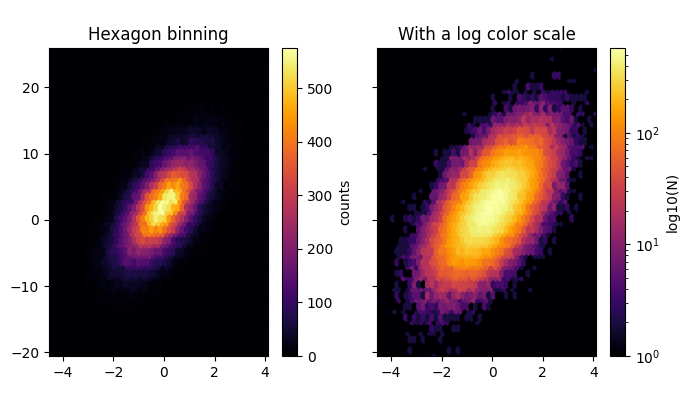
Hexbin演示
用Matplotlib绘制Hexbin。
Hexbin是一种轴法或Pyplot函数,本质上是一个二维六角形柱状图的多色。它可以比散点图提供更多的信息。在下面的第一个图中,尝试用“散点图”替换“河滨图”。
import numpy as np
import matplotlib.pyplot as plt

# Fixing random state for reproducibility
np.random.seed(19680801)

n = 100000
x = np.random.standard_normal(n)
y = 2.0 + 3.0 * x + 4.0 * np.random.standard_normal(n)
xmin = x.min()
xmax = x.max()
ymin = y.min()
ymax = y.max()

fig, axs = plt.subplots(ncols=2, sharey=True, figsize=(7, 4))
fig.subplots_adjust(hspace=0.5, left=0.07, right=0.93)
ax = axs[0]
hb = ax.hexbin(x, y, gridsize=50, cmap='inferno')
ax.set(xlim=(xmin, xmax), ylim=(ymin, ymax))
ax.set_title("Hexagon binning")
cb = fig.colorbar(hb, ax=ax)
cb.set_label('counts')

ax = axs[1]
hb = ax.hexbin(x, y, gridsize=50, bins='log', cmap='inferno')
ax.set(xlim=(xmin, xmax), ylim=(ymin, ymax))
ax.set_title("With a log color scale")
cb = fig.colorbar(hb, ax=ax)
cb.set_label('log10(N)')

plt.show()
关键词:matplotlib代码示例,codex,python plot,pyplot Gallery generated by Sphinx-Gallery