注解
Click here 下载完整的示例代码
轻松创建子批次
在Matplotlib的早期版本中,如果您想使用pythonicAPI并创建一个图形实例,然后从中创建一个子块网格,可能是使用共享轴,那么它涉及大量样板代码。例如
import matplotlib.pyplot as plt
import numpy as np


# Fixing random state for reproducibility
np.random.seed(19680801)

x = np.random.randn(50)

# old style
fig = plt.figure()
ax1 = fig.add_subplot(221)
ax2 = fig.add_subplot(222, sharex=ax1, sharey=ax1)
ax3 = fig.add_subplot(223, sharex=ax1, sharey=ax1)
ax3 = fig.add_subplot(224, sharex=ax1, sharey=ax1)
费尔南多佩雷斯提供了很好的顶级功能 subplots (注意末尾的“s”)立即创建所有内容,并为整个群启用x和y共享。你可以单独打开轴。。。
# new style method 1; unpack the axes
fig, ((ax1, ax2), (ax3, ax4)) = plt.subplots(2, 2, sharex=True, sharey=True)
ax1.plot(x)
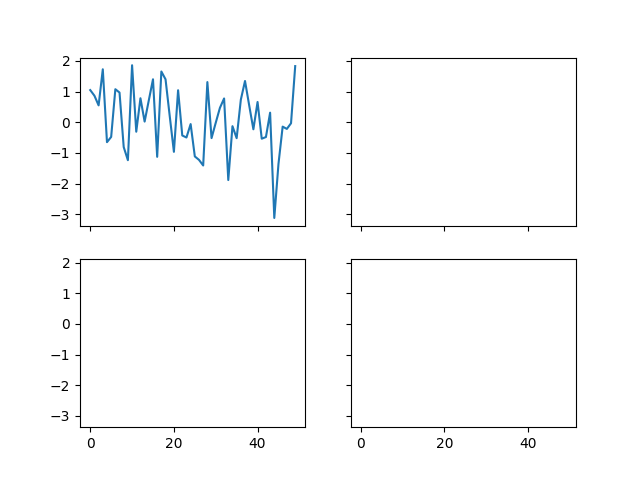
出:
[<matplotlib.lines.Line2D object at 0x7fa9bd98b630>]
或者将它们作为支持numpy索引的numRows x numColumns对象数组返回

脚本的总运行时间: (0分1.181秒)
关键词:matplotlib代码示例,codex,python plot,pyplot Gallery generated by Sphinx-Gallery