注解
Click here 下载完整的示例代码
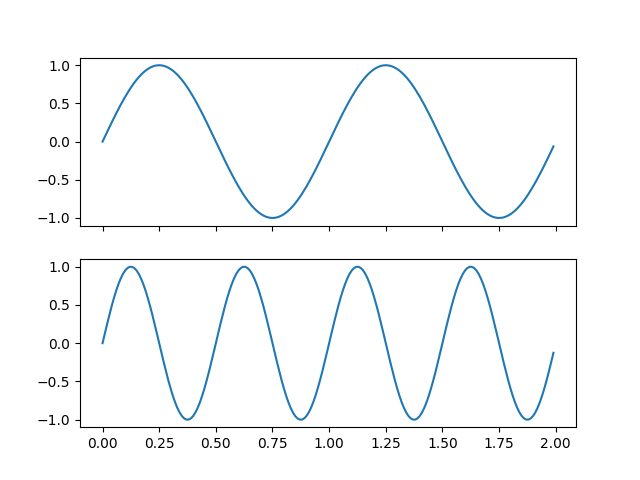
多胞体
同时在多个绘图上显示光标。
此示例生成两个子块,将光标悬停在一个子块中的数据上时,该数据点的值分别显示在两个子块中。
import numpy as np
import matplotlib.pyplot as plt
from matplotlib.widgets import MultiCursor

t = np.arange(0.0, 2.0, 0.01)
s1 = np.sin(2*np.pi*t)
s2 = np.sin(4*np.pi*t)

fig, (ax1, ax2) = plt.subplots(2, sharex=True)
ax1.plot(t, s1)
ax2.plot(t, s2)

multi = MultiCursor(fig.canvas, (ax1, ax2), color='r', lw=1)
plt.show()
关键词:matplotlib代码示例,codex,python plot,pyplot Gallery generated by Sphinx-Gallery