注解
Click here 下载完整的示例代码
GridSpec演示
这个例子演示了 GridSpec 为了生成子批,用 width_ratios 和 height_ratios ,以及使用子批次参数控制子批次周围和之间的间距( left , 正确的 , 底部 , top , WSPACE 和 水平间距 )
import matplotlib.pyplot as plt
from matplotlib.gridspec import GridSpec
def annotate_axes(fig):
for i, ax in enumerate(fig.axes):
ax.text(0.5, 0.5, "ax%d" % (i+1), va="center", ha="center")
ax.tick_params(labelbottom=False, labelleft=False)
fig = plt.figure()
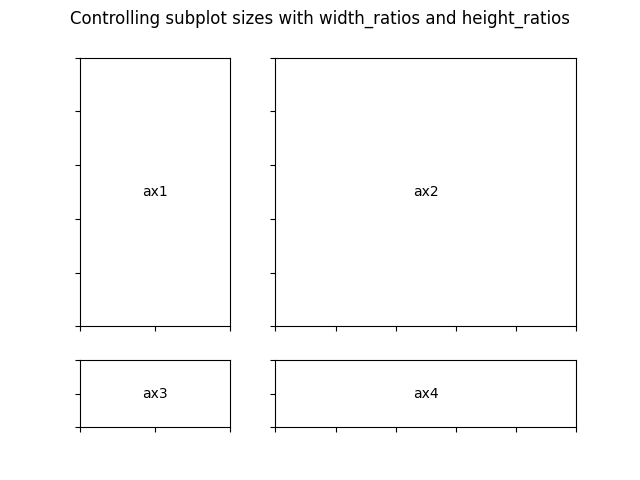
fig.suptitle("Controlling subplot sizes with width_ratios and height_ratios")
gs = GridSpec(2, 2, width_ratios=[1, 2], height_ratios=[4, 1])
ax1 = fig.add_subplot(gs[0])
ax2 = fig.add_subplot(gs[1])
ax3 = fig.add_subplot(gs[2])
ax4 = fig.add_subplot(gs[3])
annotate_axes(fig)
fig = plt.figure()
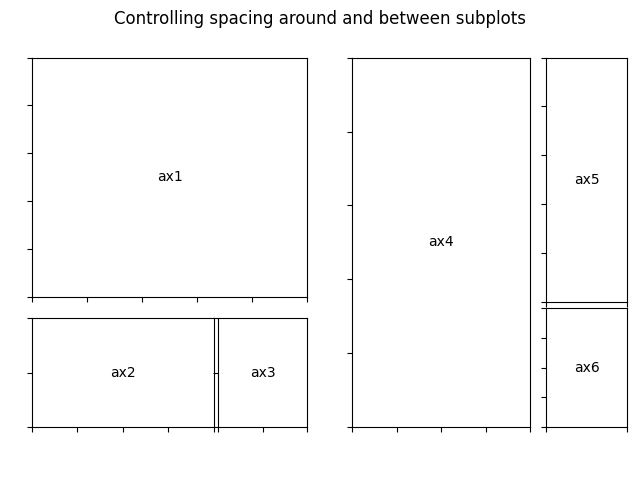
fig.suptitle("Controlling spacing around and between subplots")
gs1 = GridSpec(3, 3, left=0.05, right=0.48, wspace=0.05)
ax1 = fig.add_subplot(gs1[:-1, :])
ax2 = fig.add_subplot(gs1[-1, :-1])
ax3 = fig.add_subplot(gs1[-1, -1])
gs2 = GridSpec(3, 3, left=0.55, right=0.98, hspace=0.05)
ax4 = fig.add_subplot(gs2[:, :-1])
ax5 = fig.add_subplot(gs2[:-1, -1])
ax6 = fig.add_subplot(gs2[-1, -1])
annotate_axes(fig)
plt.show()
关键词:matplotlib代码示例,codex,python plot,pyplot Gallery generated by Sphinx-Gallery