注解
Click here 下载完整的示例代码
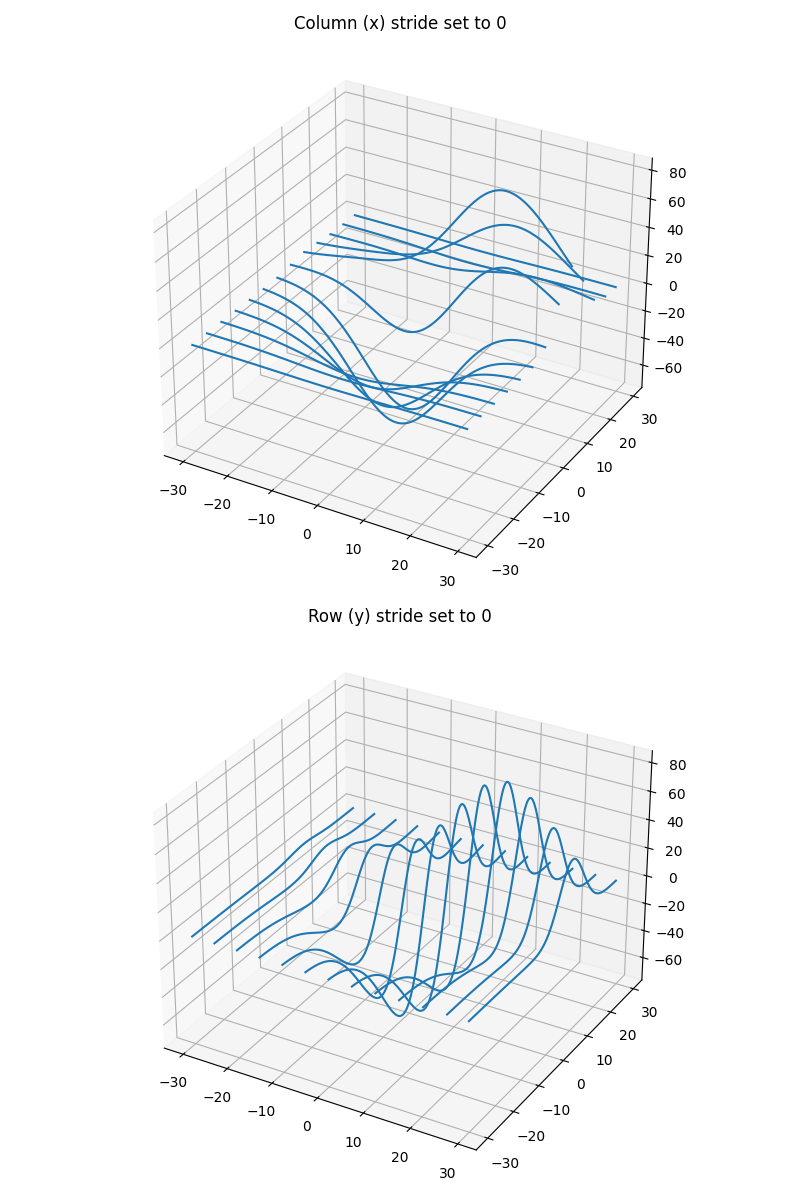
一个方向的三维线框图
说明将rstride或cstride设置为0会导致在相应方向上不生成导线。
from mpl_toolkits.mplot3d import axes3d
import matplotlib.pyplot as plt


fig, (ax1, ax2) = plt.subplots(
    2, 1, figsize=(8, 12), subplot_kw={'projection': '3d'})

# Get the test data
X, Y, Z = axes3d.get_test_data(0.05)

# Give the first plot only wireframes of the type y = c
ax1.plot_wireframe(X, Y, Z, rstride=10, cstride=0)
ax1.set_title("Column (x) stride set to 0")

# Give the second plot only wireframes of the type x = c
ax2.plot_wireframe(X, Y, Z, rstride=0, cstride=10)
ax2.set_title("Row (y) stride set to 0")

plt.tight_layout()
plt.show()
脚本的总运行时间: (0分1.622秒)
关键词:matplotlib代码示例,codex,python plot,pyplot Gallery generated by Sphinx-Gallery