注解
Click here 下载完整的示例代码
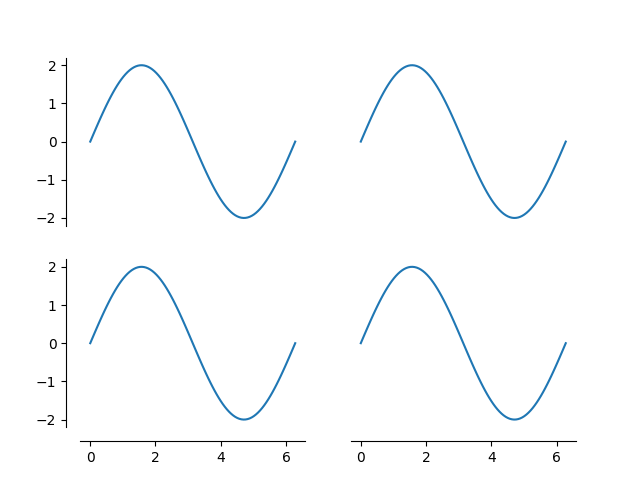
新增0.99刺
import matplotlib.pyplot as plt
import numpy as np


def adjust_spines(ax, spines):
    for loc, spine in ax.spines.items():
        if loc in spines:
            spine.set_position(('outward', 10))  # outward by 10 points
        else:
            spine.set_color('none')  # don't draw spine

    # turn off ticks where there is no spine
    if 'left' in spines:
        ax.yaxis.set_ticks_position('left')
    else:
        # no yaxis ticks
        ax.yaxis.set_ticks([])

    if 'bottom' in spines:
        ax.xaxis.set_ticks_position('bottom')
    else:
        # no xaxis ticks
        ax.xaxis.set_ticks([])

fig = plt.figure()

x = np.linspace(0, 2*np.pi, 100)
y = 2*np.sin(x)

ax = fig.add_subplot(2, 2, 1)
ax.plot(x, y)
adjust_spines(ax, ['left'])

ax = fig.add_subplot(2, 2, 2)
ax.plot(x, y)
adjust_spines(ax, [])

ax = fig.add_subplot(2, 2, 3)
ax.plot(x, y)
adjust_spines(ax, ['left', 'bottom'])

ax = fig.add_subplot(2, 2, 4)
ax.plot(x, y)
adjust_spines(ax, ['bottom'])

plt.show()
工具书类
以下函数、方法、类和模块的使用如本例所示:
出:
<function Spine.set_position at 0x7faa00da01e0>
关键词:matplotlib代码示例,codex,python plot,pyplot Gallery generated by Sphinx-Gallery