注解
Click here 下载完整的示例代码
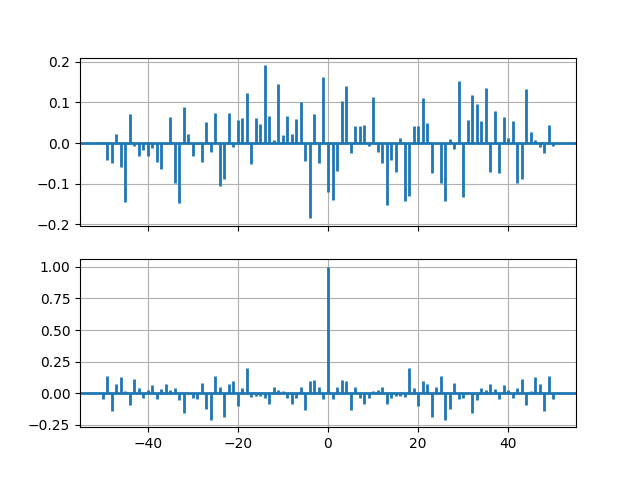
交叉和自相关演示
互相关的示例使用 (xcorr )和自相关 (acorr 情节。
import matplotlib.pyplot as plt
import numpy as np


# Fixing random state for reproducibility
np.random.seed(19680801)


x, y = np.random.randn(2, 100)
fig, [ax1, ax2] = plt.subplots(2, 1, sharex=True)
ax1.xcorr(x, y, usevlines=True, maxlags=50, normed=True, lw=2)
ax1.grid(True)

ax2.acorr(x, usevlines=True, normed=True, maxlags=50, lw=2)
ax2.grid(True)

plt.show()
工具书类
以下函数、方法、类和模块的使用如本例所示:
出:
<function xcorr at 0x7faa00cfde18>
关键词:matplotlib代码示例,codex,python plot,pyplot Gallery generated by Sphinx-Gallery